Victoria Boulet
VB

Data and analytics to determine sustainability goals and risk parameters.  
The Problem:

The client had no reliable interface to analyze risk profiles. Users had to use various tools to manually create reports to plan for upcoming mitigation projects. These reports were not easily manipulated to see how altering  parameters would impact risk reduction and or budget.  

My Role:
Lead Product Designer
Tools:
Figma, Mural, Maze, Azure DevOps
The Challenge:

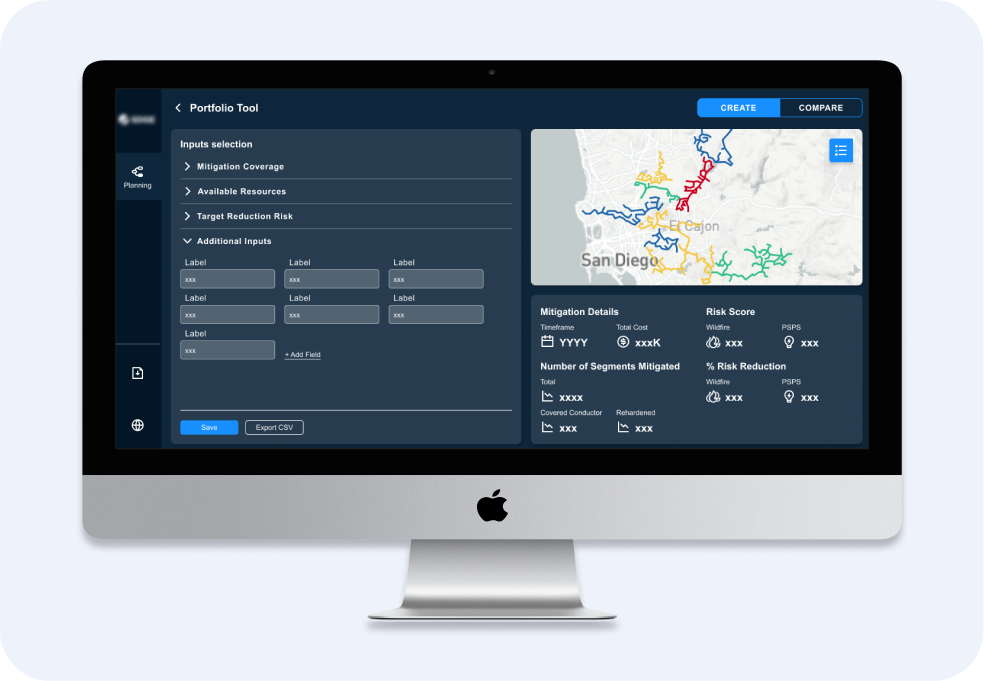
WiNGS Planning is a portfolio tool that was built upon and scaled on top of WiNGS Ops. The tool allows users to adjust and run various mitigation models that  recommend various grid-hardening initiatives. Users can then compare each scenario before proposing the best option for forecasted projects - getting the company the best bang for their buck and the best options to help mitigate the impacts of climate change.

Impact:

In the first year the tool was implemented  the company was able to reduce wildfire risk and minimize Public Safety Power Shutoffs by using the tool to plan and budget for hardening of 590 miles of power lines.
More planned mitigation projects mean less emergencies- the company saved over 11 million in PSPS notification penalty fees compared to their competitors.
Summary

WiNGS Planning is a portfolio tool that was built upon and scaled on top of WiNGS Ops. The tool allows users to adjust and run various mitigation models that  recommend various grid-hardening initiatives. Users can then compare each scenario before proposing the best option for forecasted projects - getting the company the best bang for their buck and the best options to help mitigate the impacts of climate change.

Understand: Empathize & Define

Research Goals

I like to start off my exploration stage by stepping into my user’s shoes. By walking or in this case, (design) sprinting a mile in their shoes allows me to gain deeper insights which eventually lead to solutions. With the users, creativity and innovation in mind I challenged myself to visualize problems as opportunities.

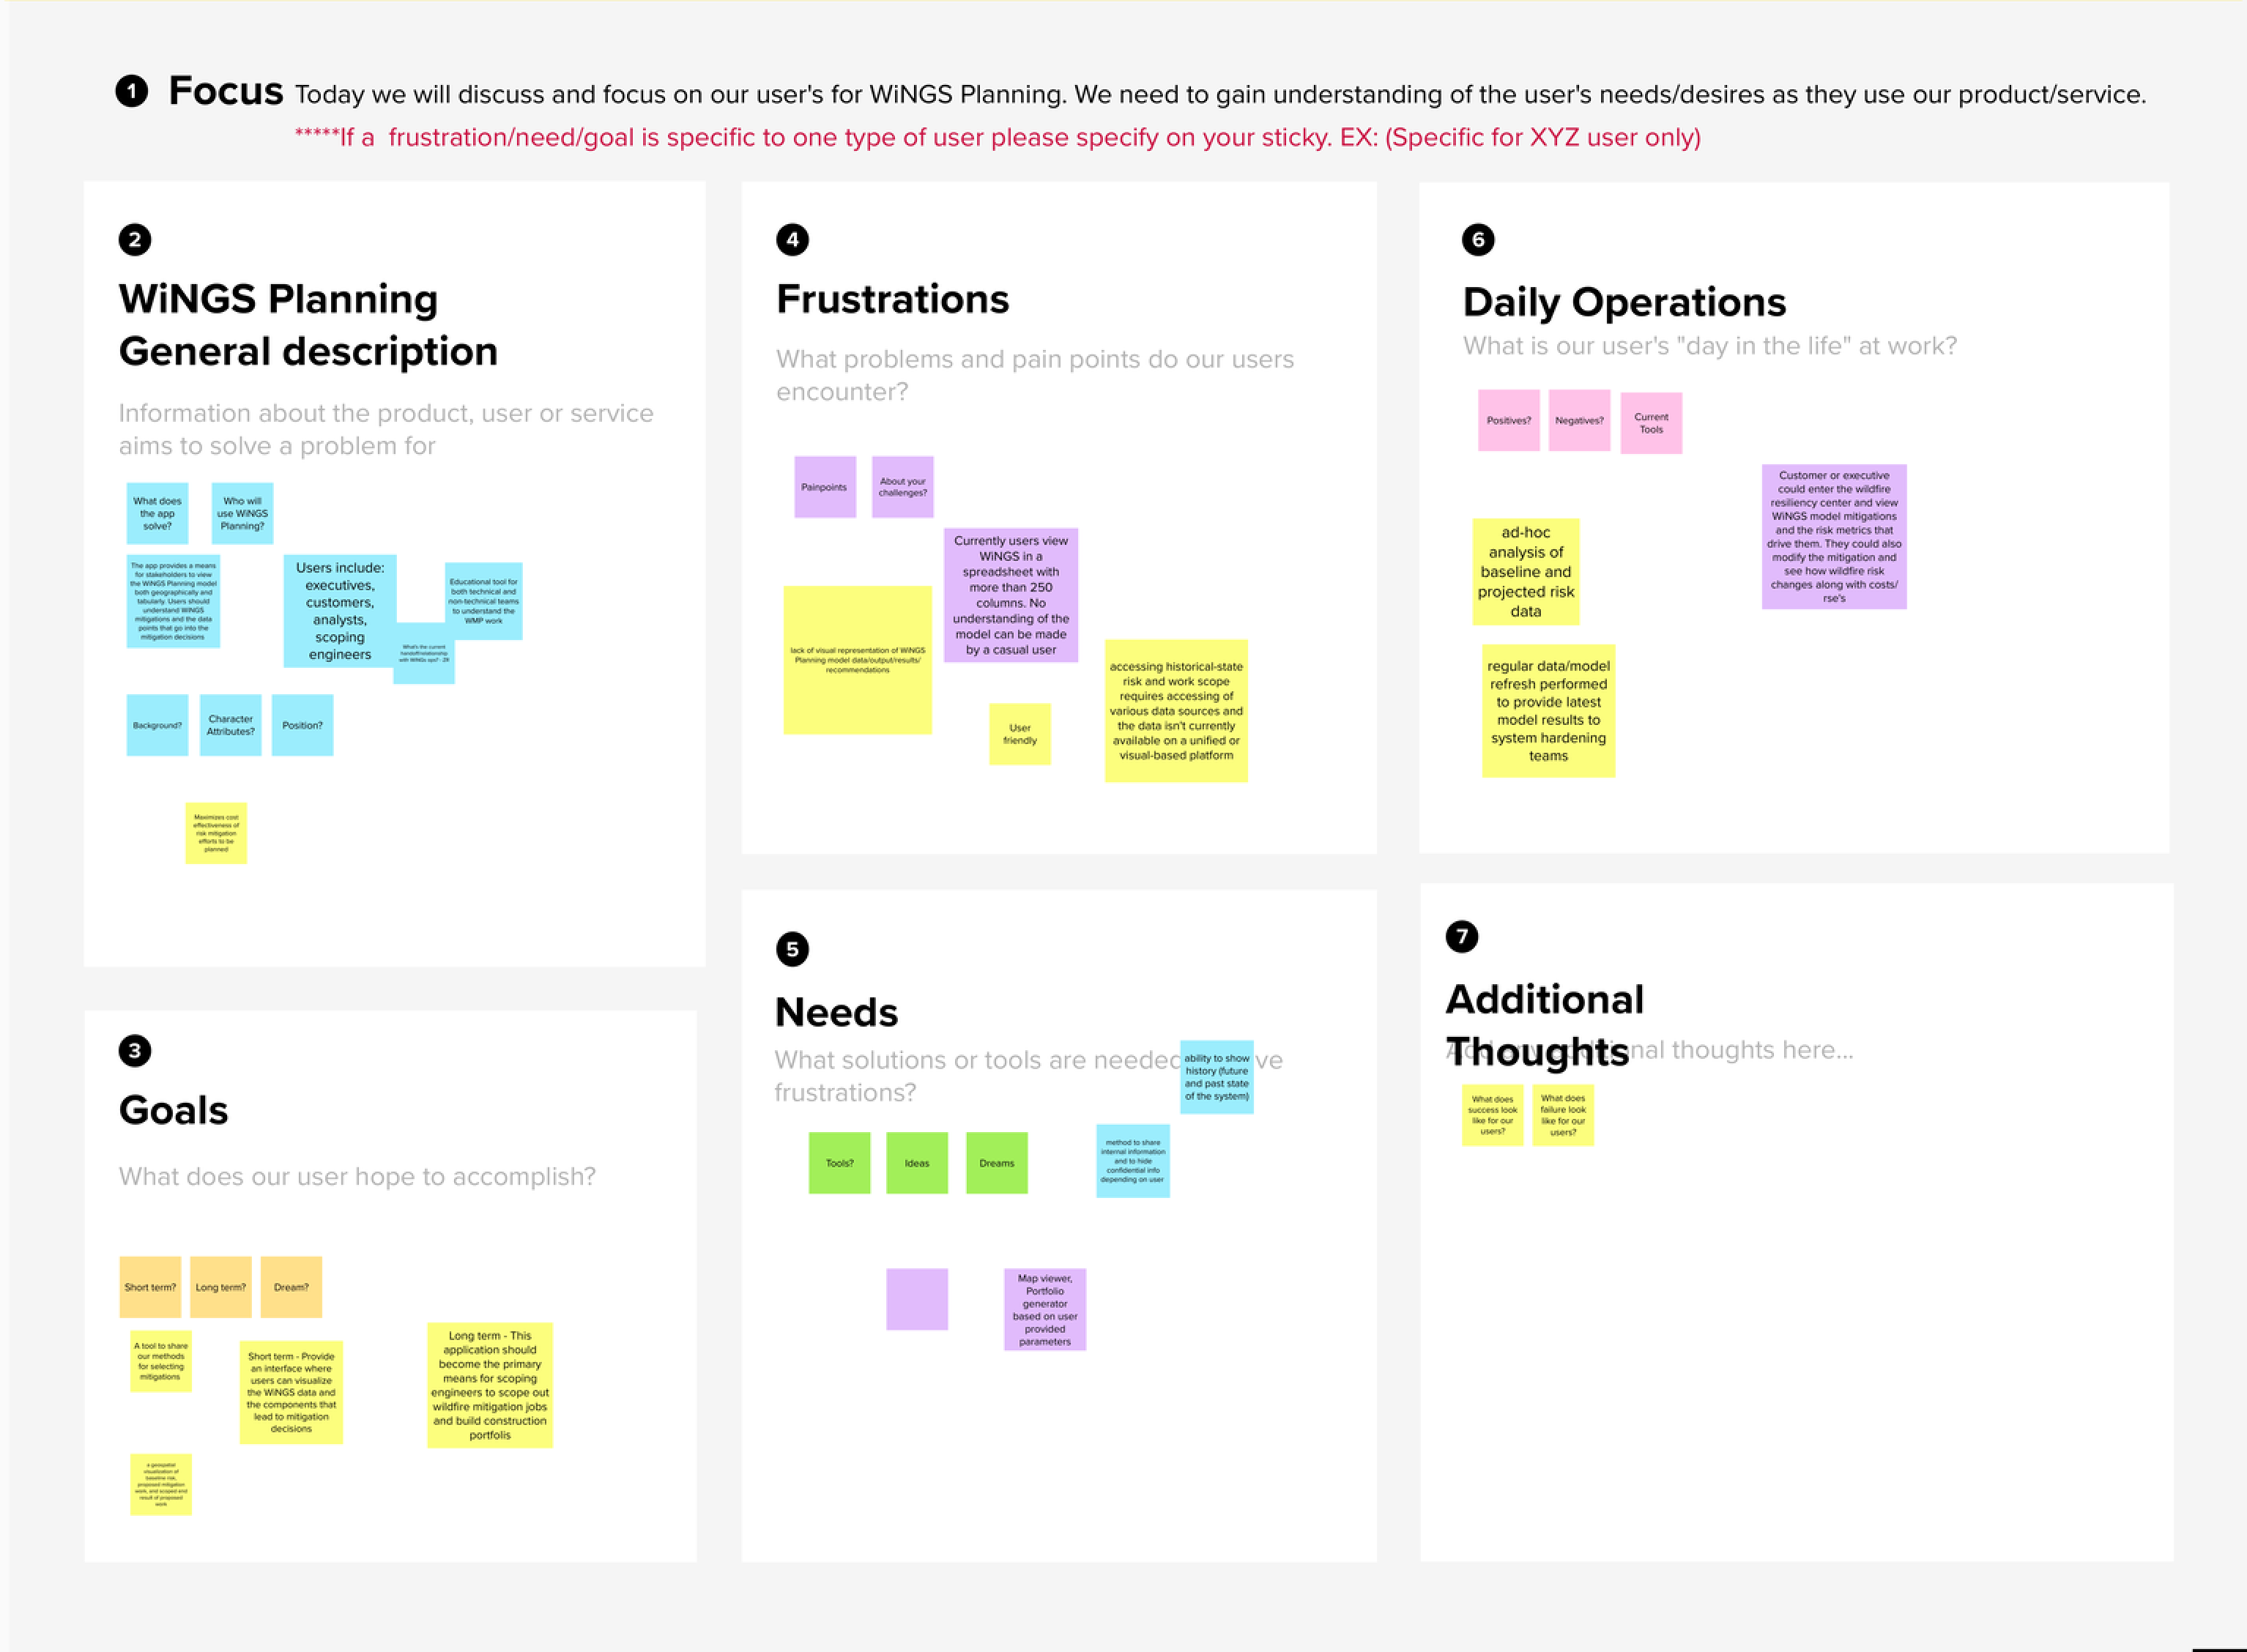
Our team knew that this tool would be integrated an embedded within the larger platform WiNGS Ops, but I knew that the users  using the  Planning tool would have specific needs. To dive into research we kicked off with a multi-day design workshop.

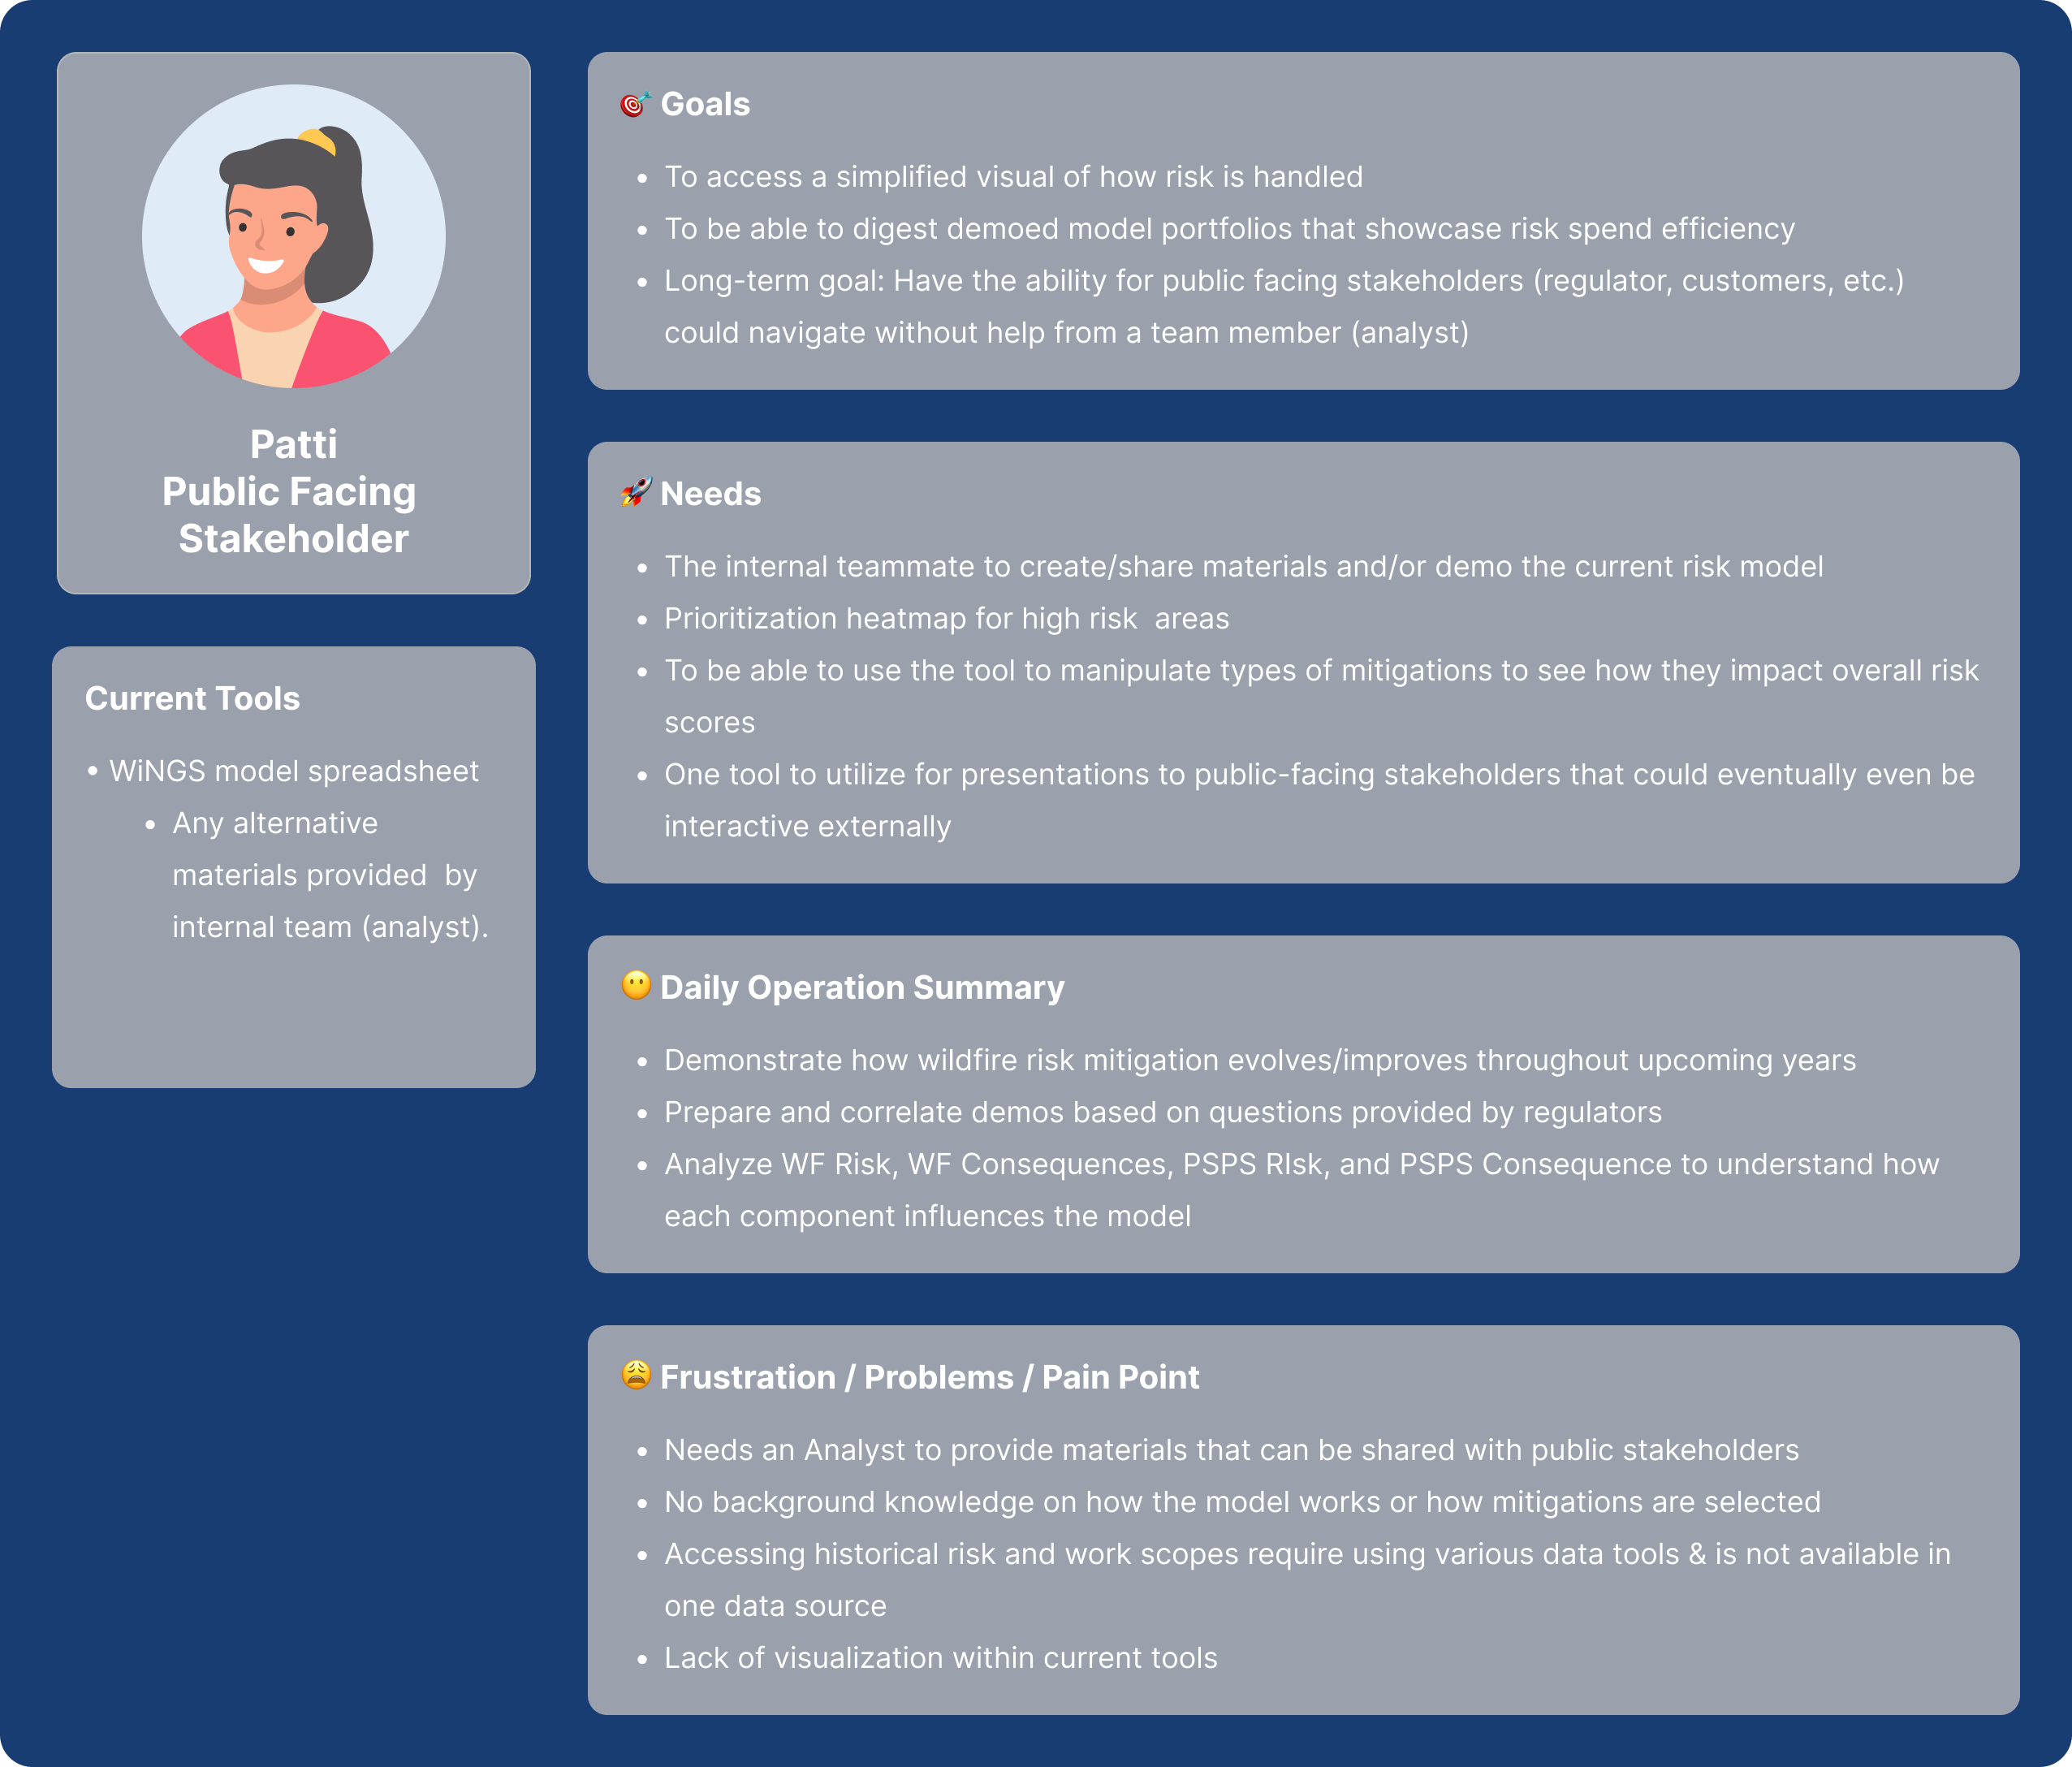
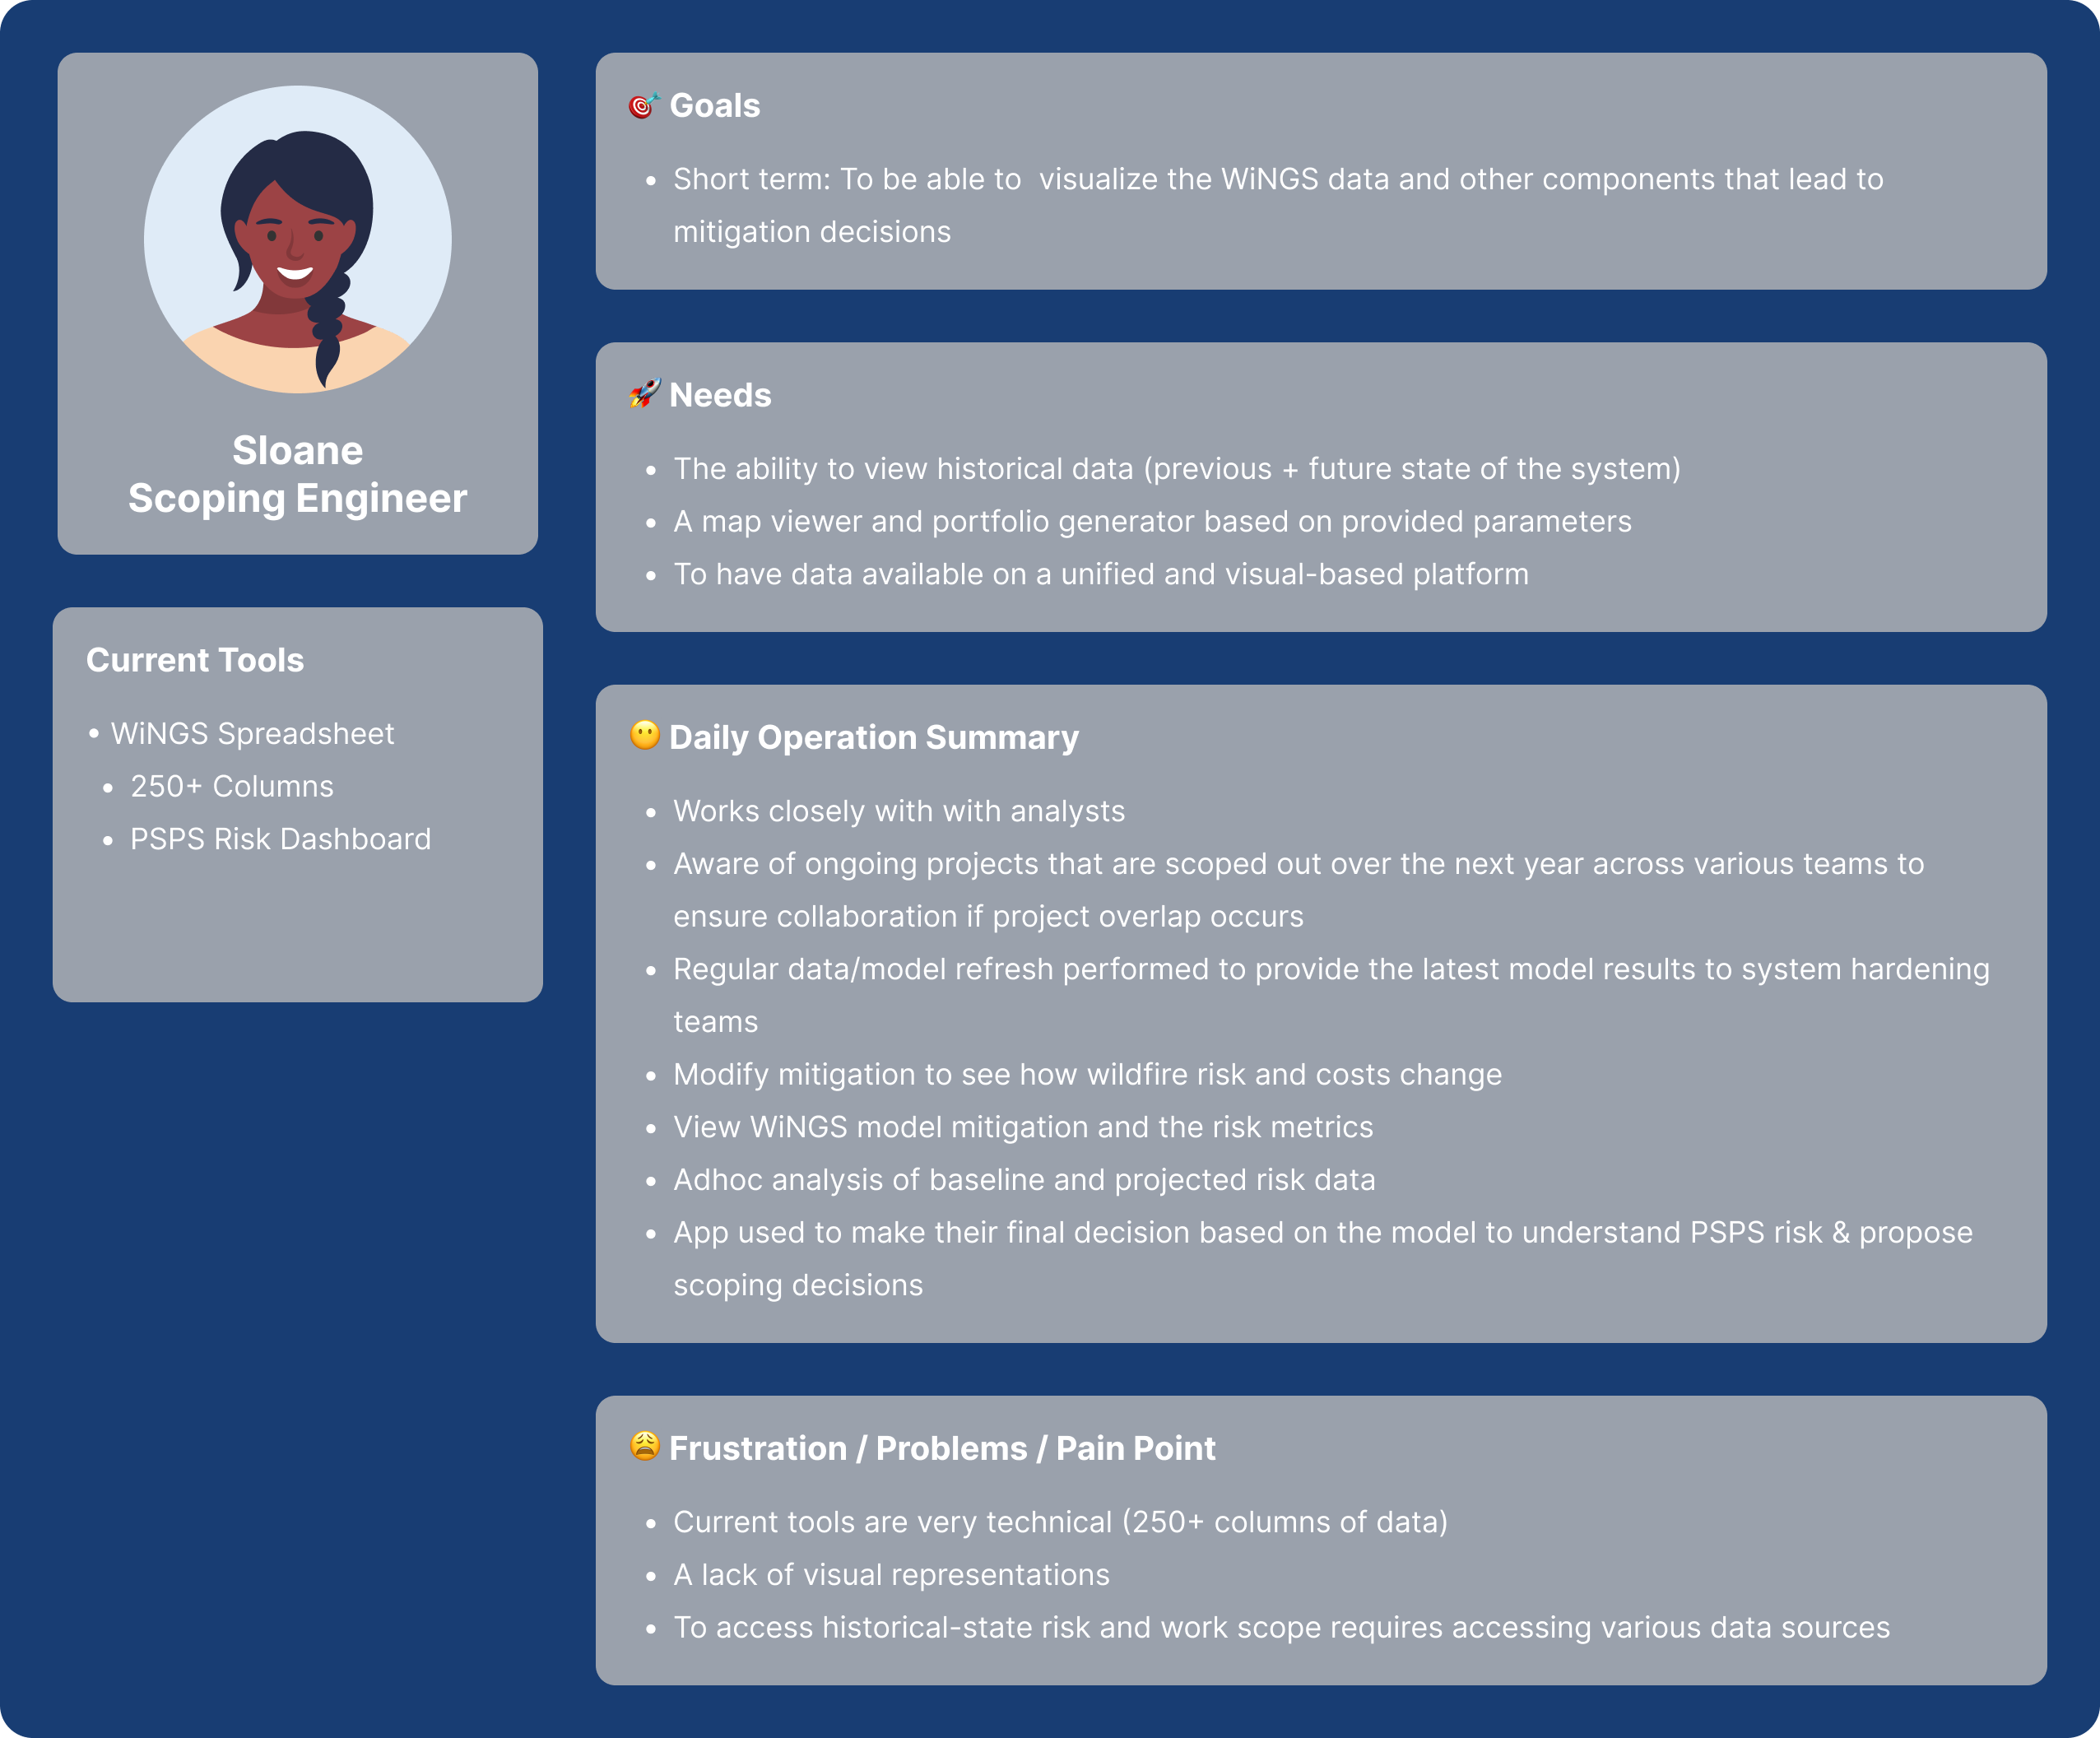
Meet Aneesh, Sloane, Ezra, & Patti

During our design sprints we identified four main user personas.

Product Vision

Portfolio Modeling

A self-service model editing and comparison tool that empower’s analysts and scoping engineers to manipulate model predictions to see how altering parameters impact risk reduction and cost efficiency.

In-depth Circuit Metrics

Circuit and segment specific metrics for customer, asset and risk impact and ability to manipulate these data points on the map view.

Heat Map Overlay

Heat map overlay on map viewer tool of both wildfire and public safety power shutoff risk.

Time Slider Functionality

Allow users to alter risk overtime in the region based on model-suggested mitigations.

Explore: Ideate & Prototype

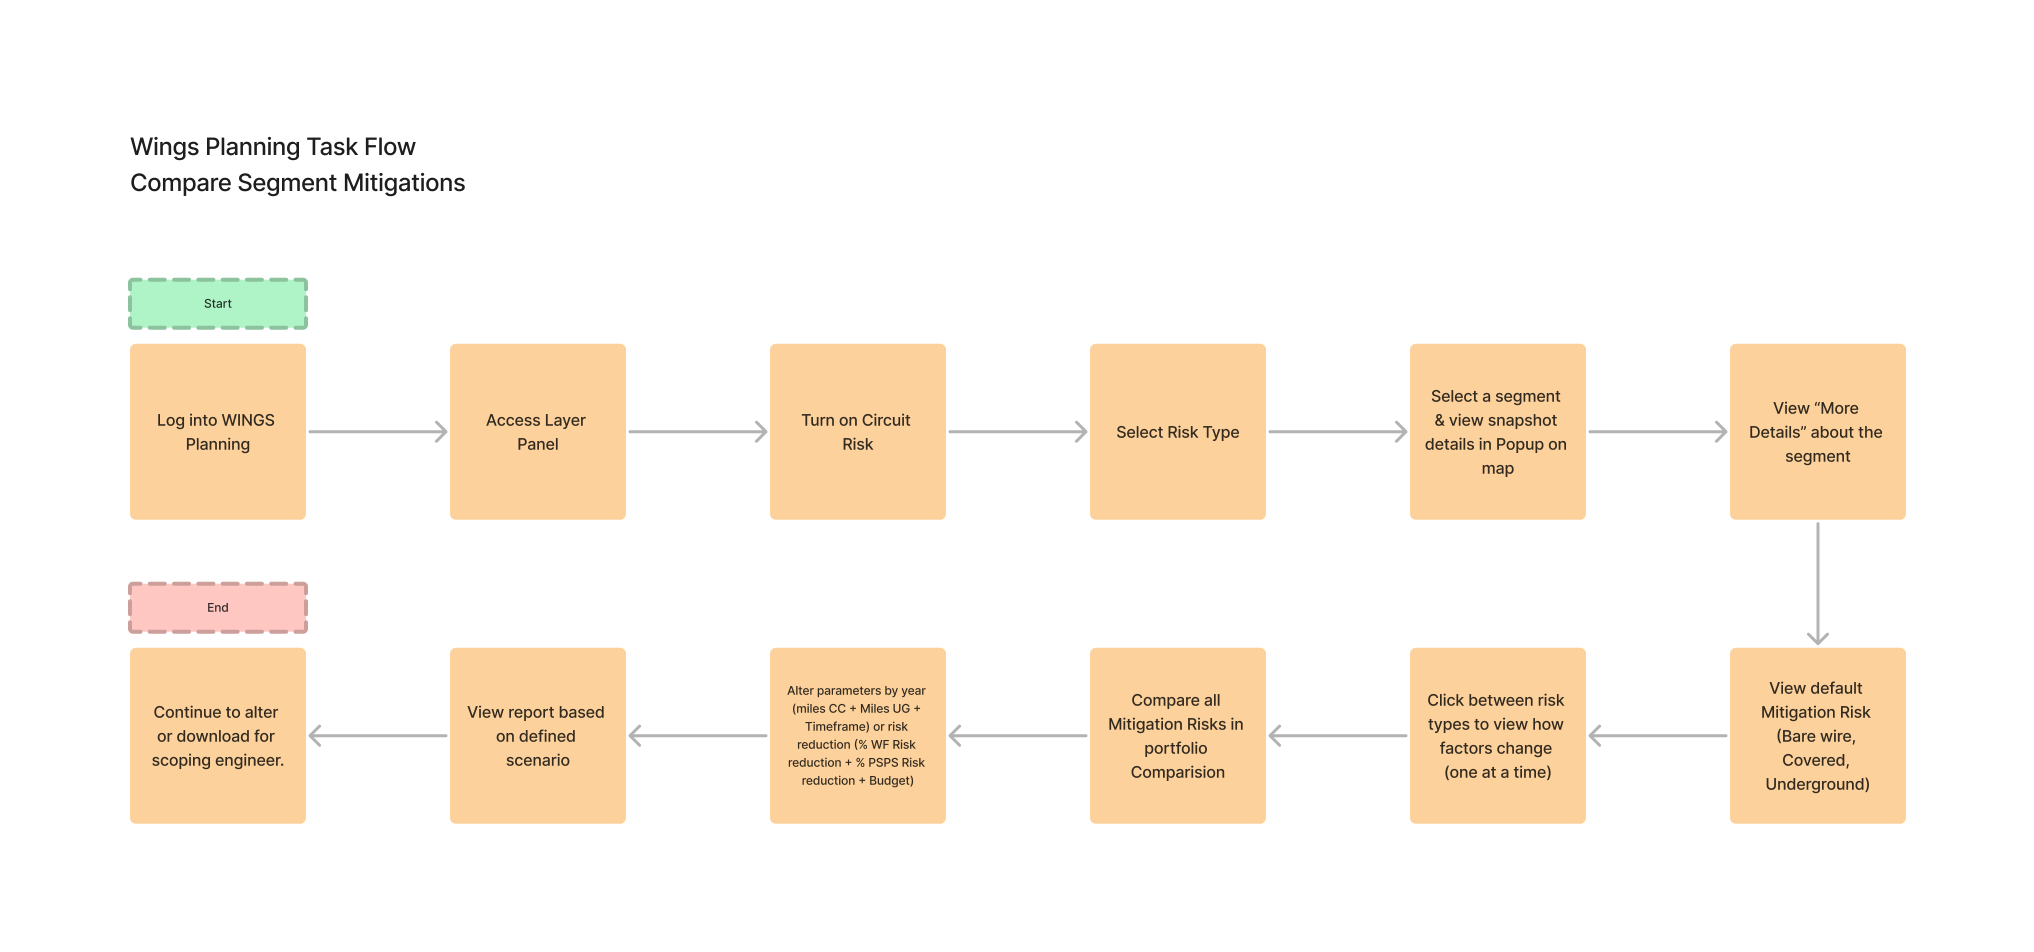
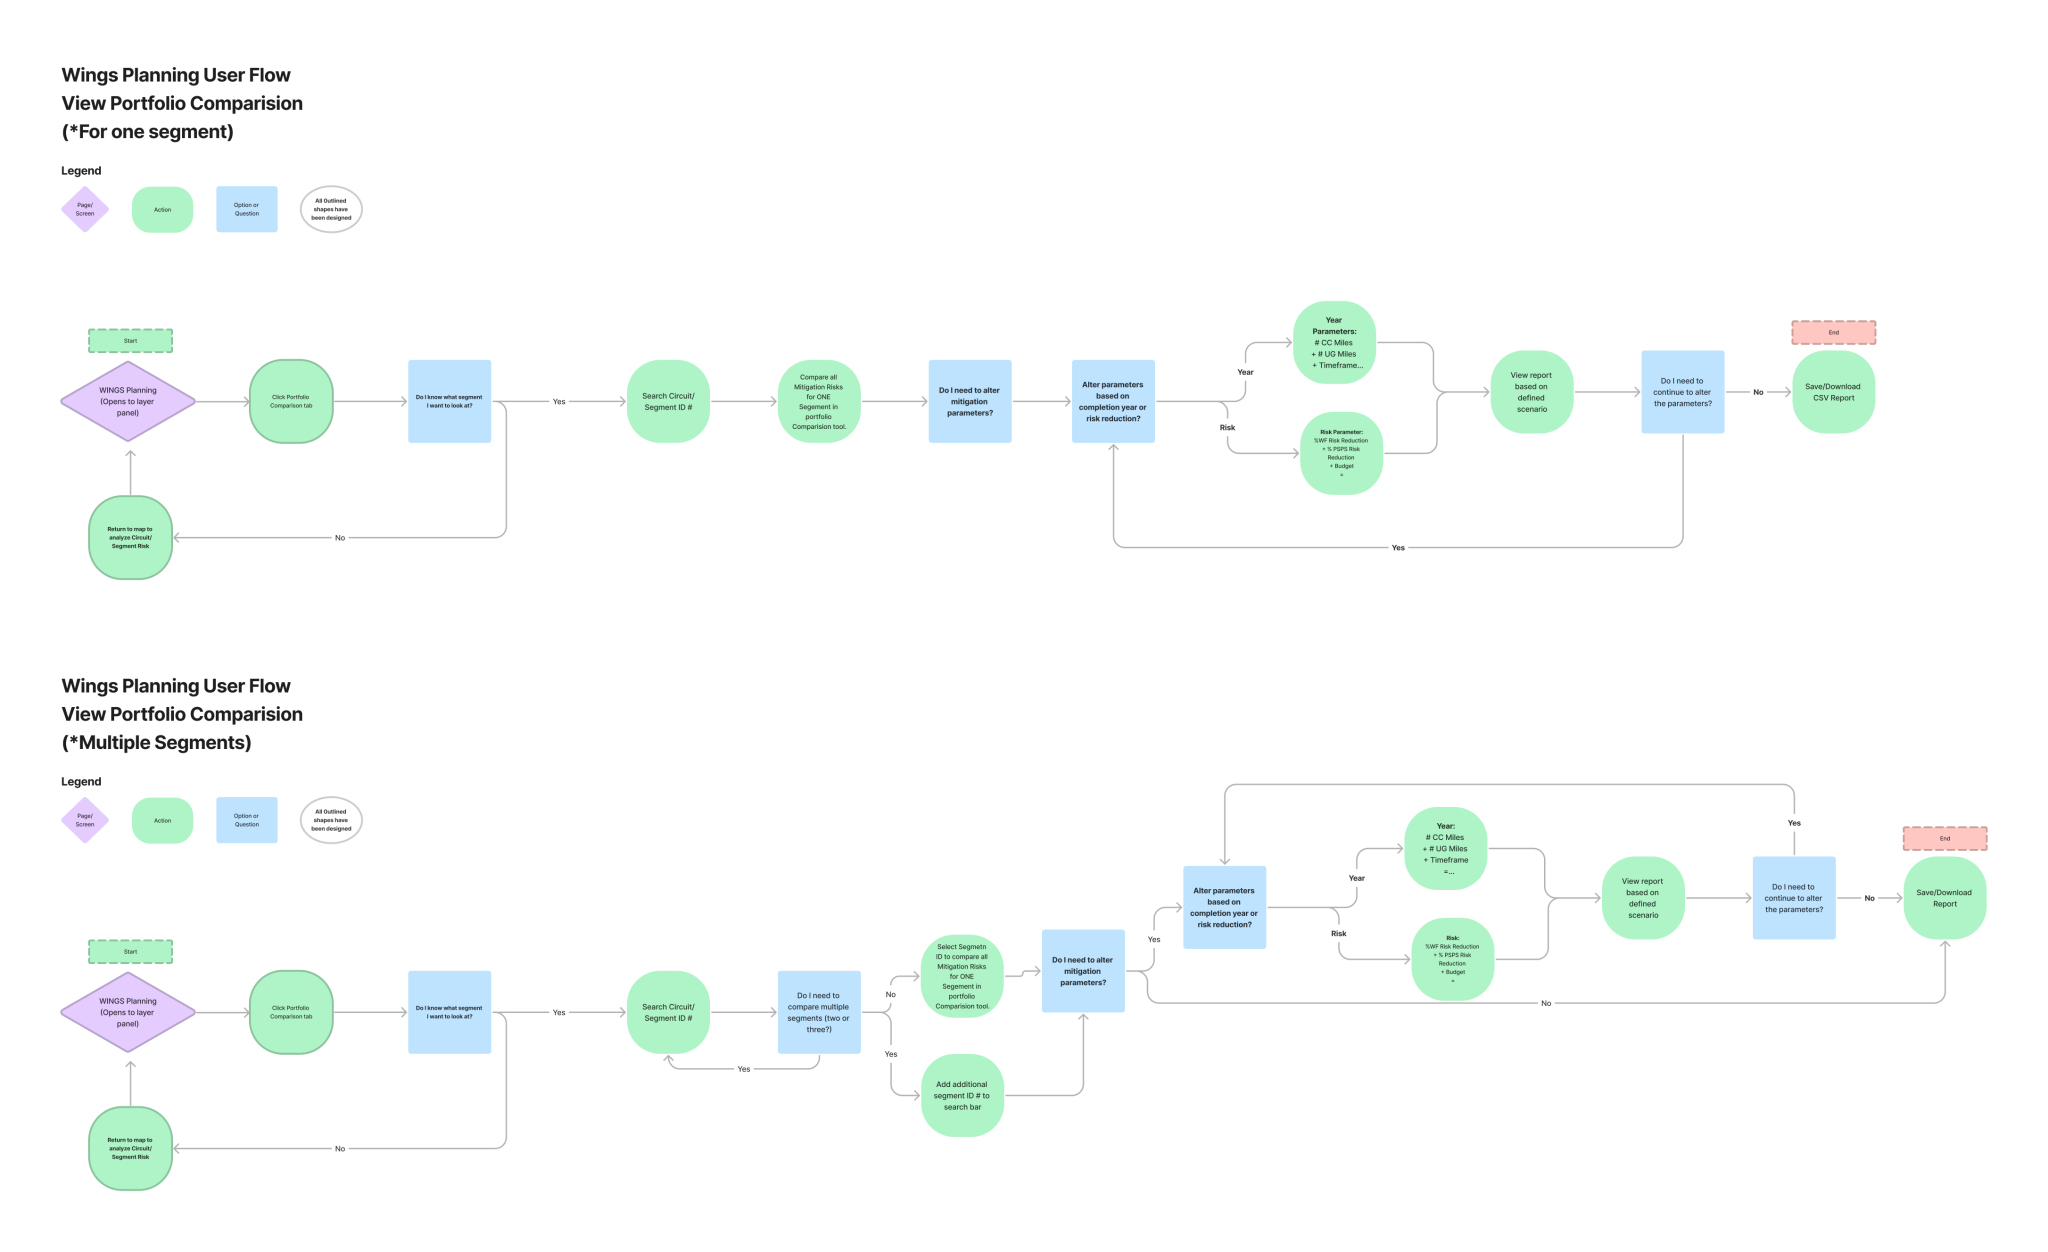
We Flowing

During our design sprints we went wide and explored various user and task flows for the Portfolio Tool and Mitigation Comparison. We kept iterating and going back to the drawing board until one felt right (and was a hit with our users!).

Design System

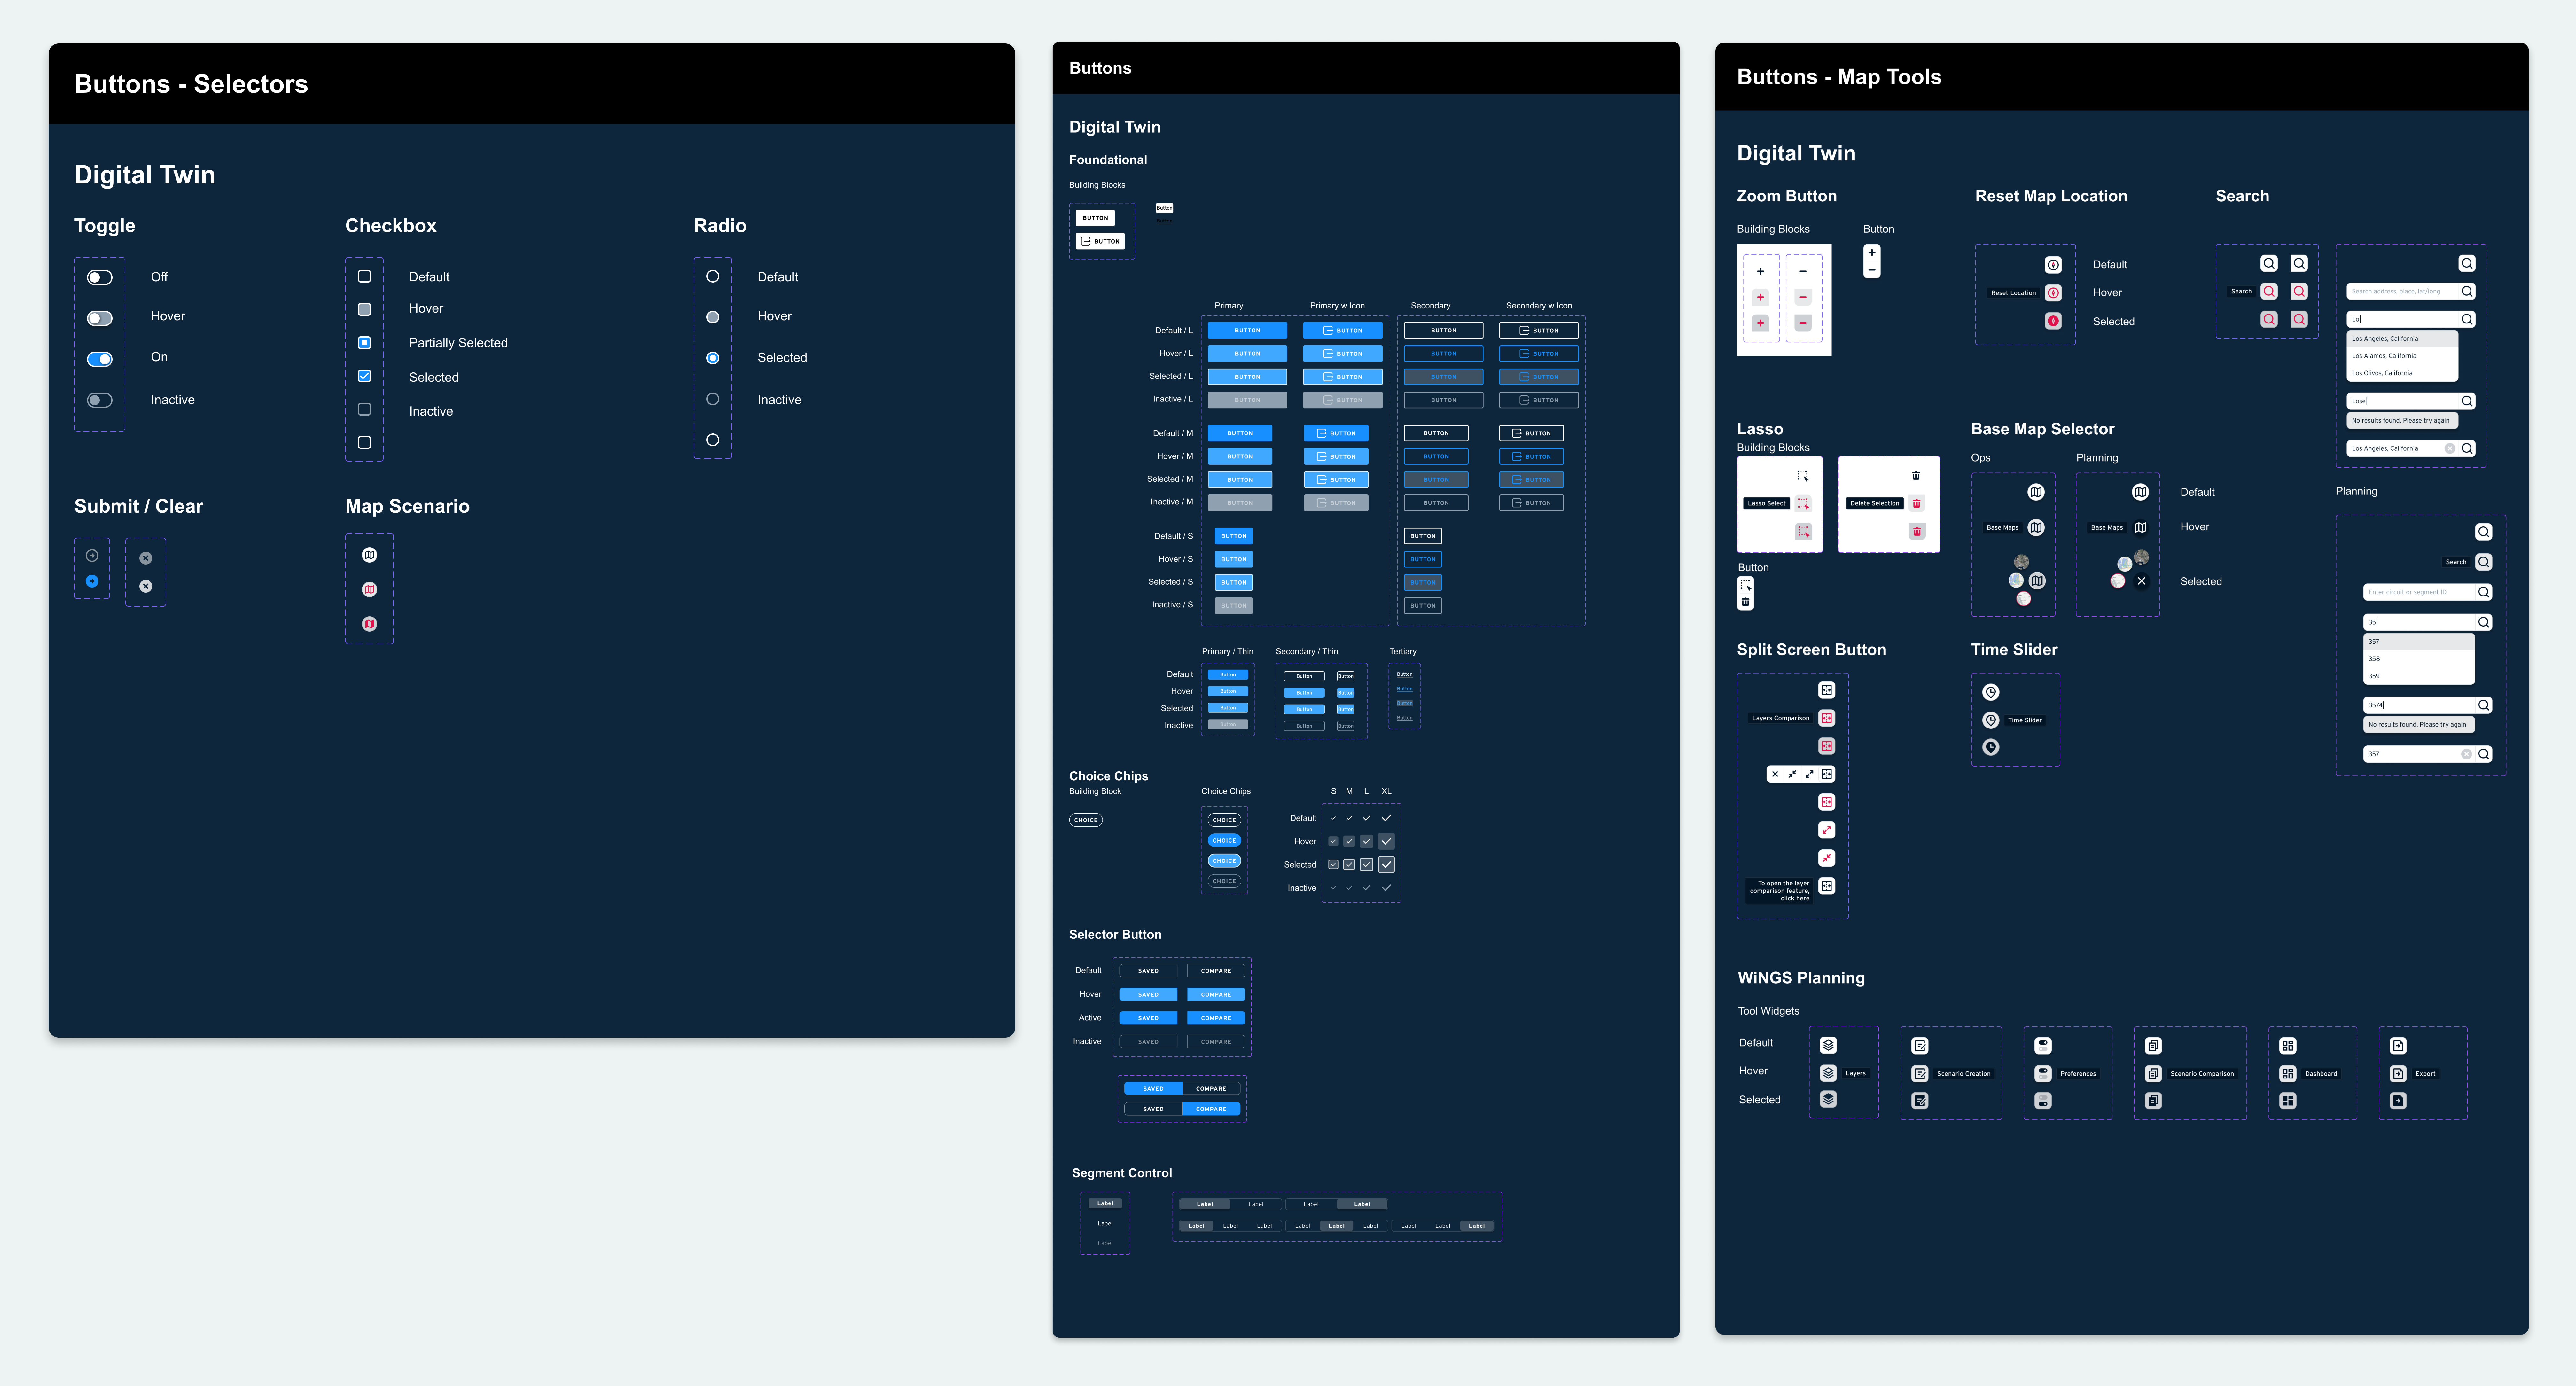
Continued to build the Digital Twin design system from scratch while making updates and maintaining components. This design system is now used on all Digital Twin initiatives providing  consistent, data-driven solutions across all platforms, and are in alignment with core site and branding strategy.  

Design & Deliver

Final Designs

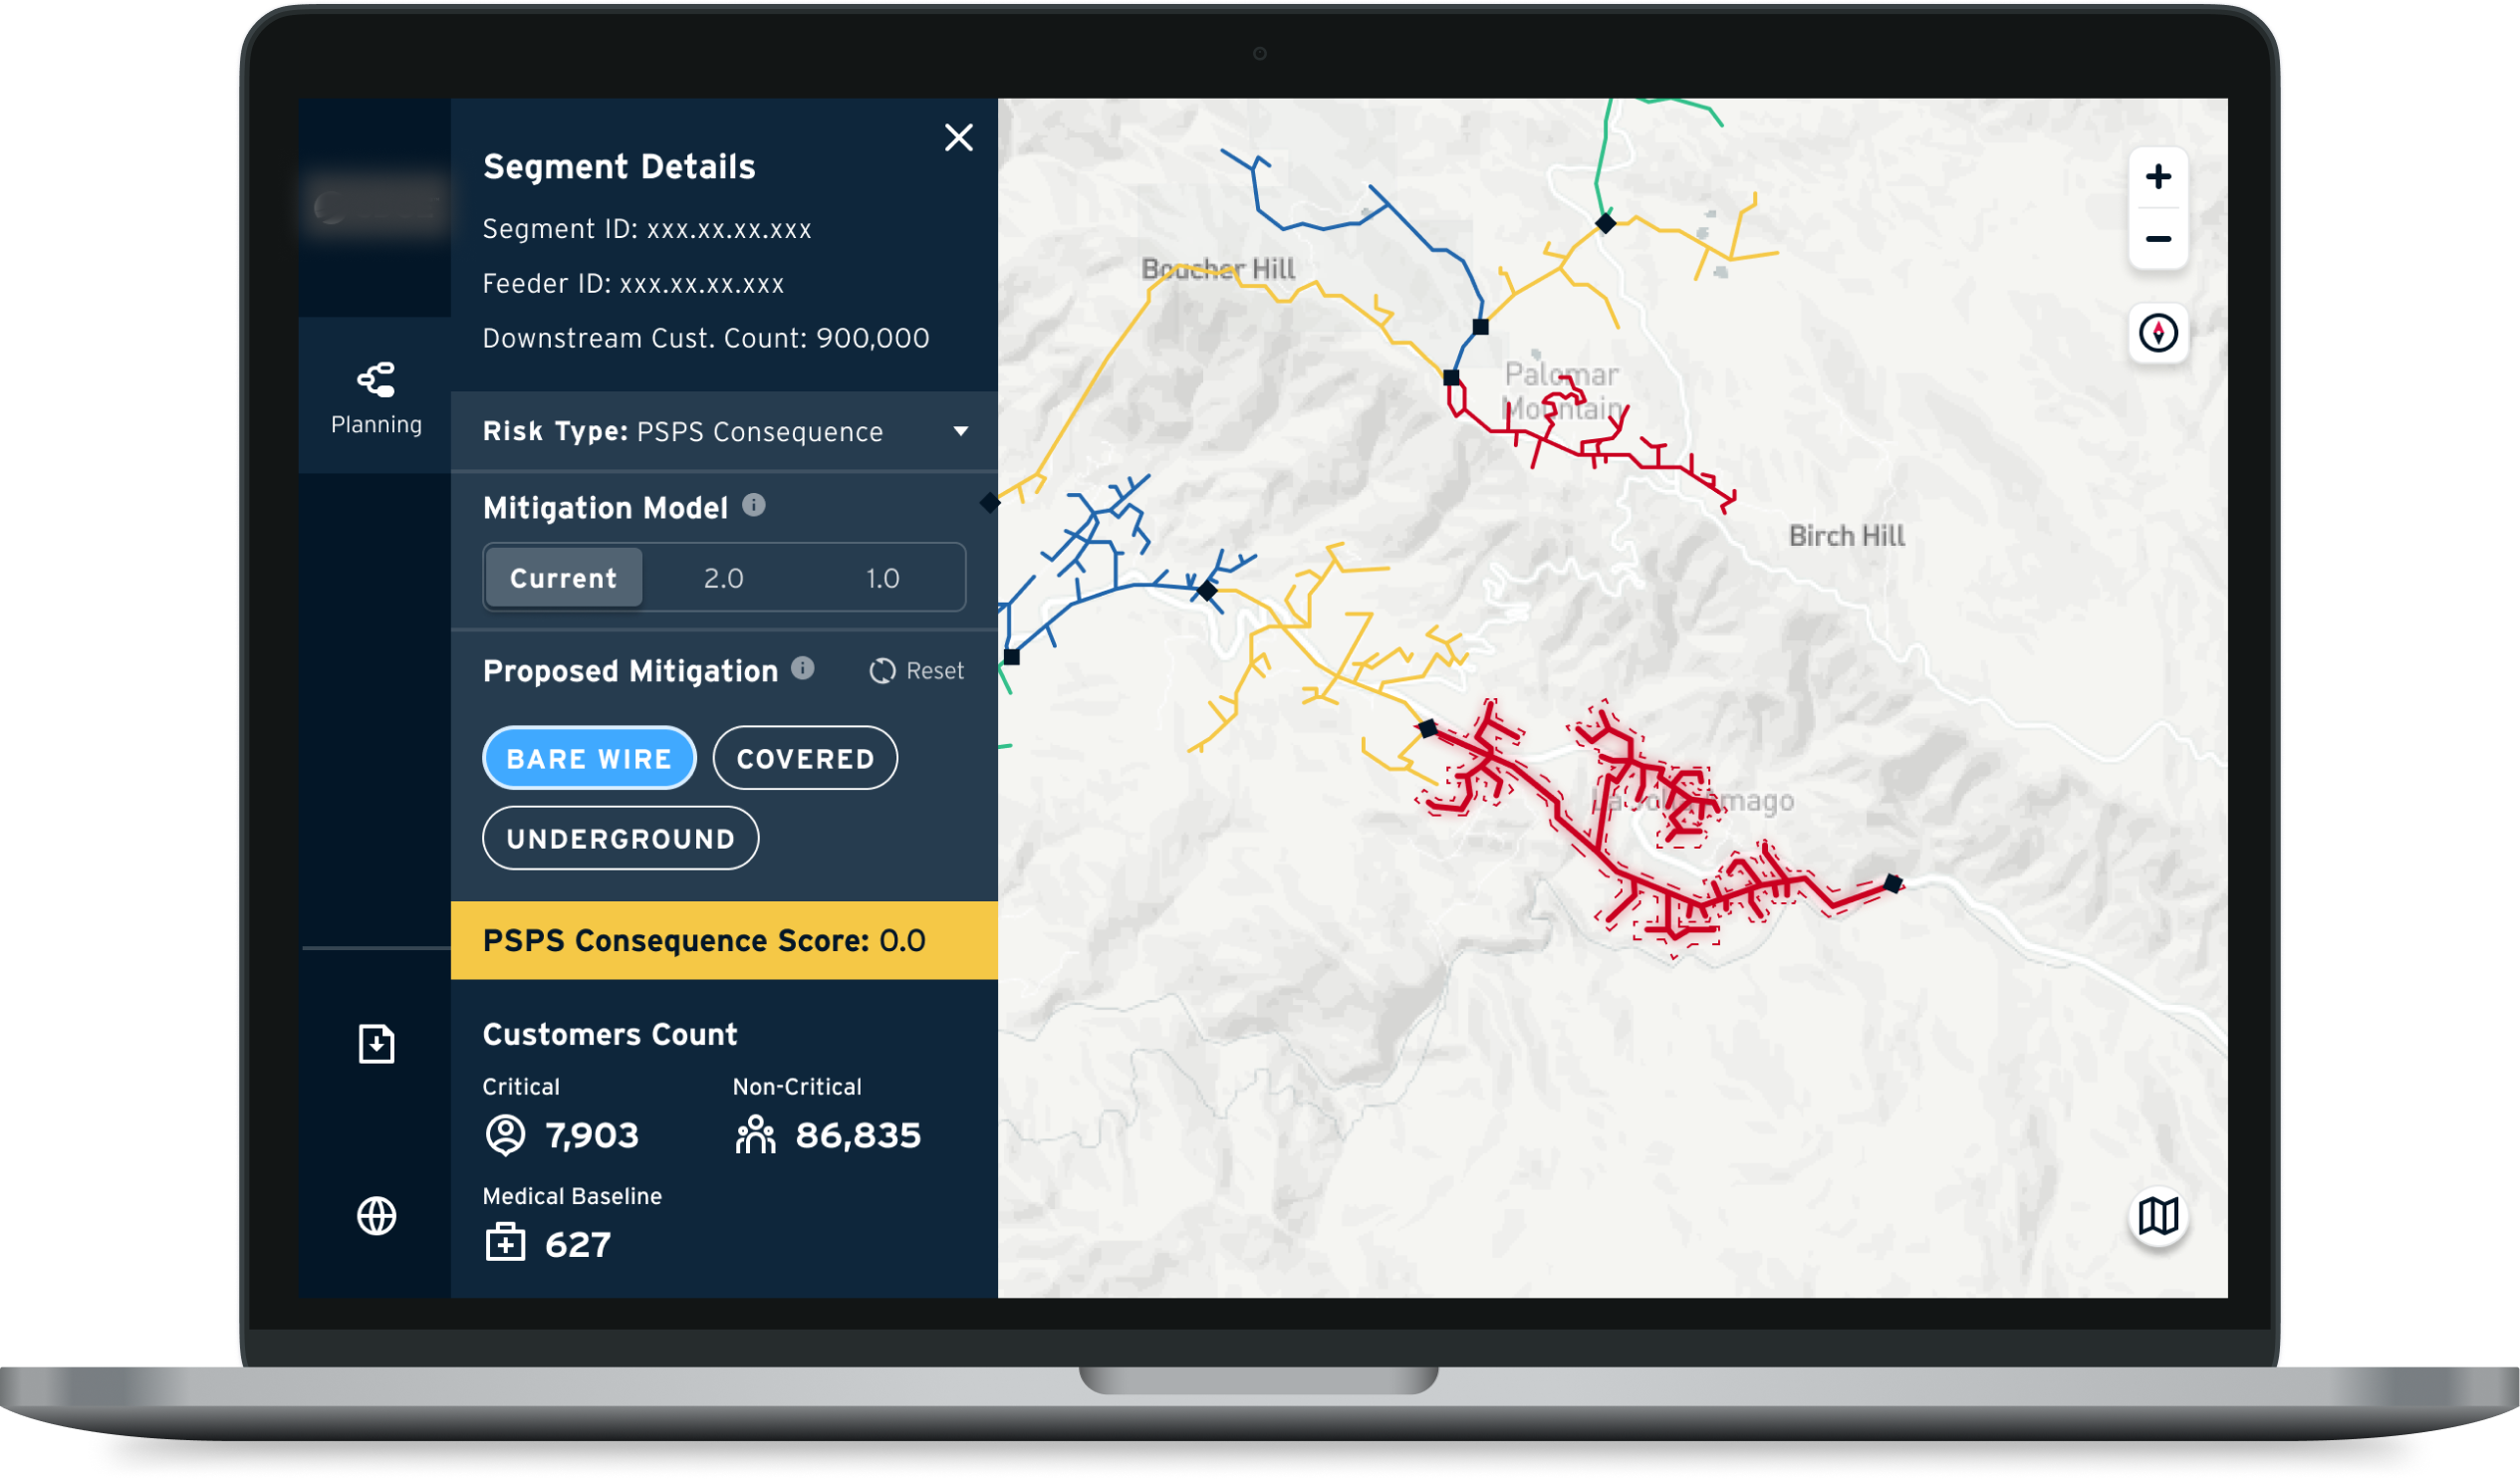
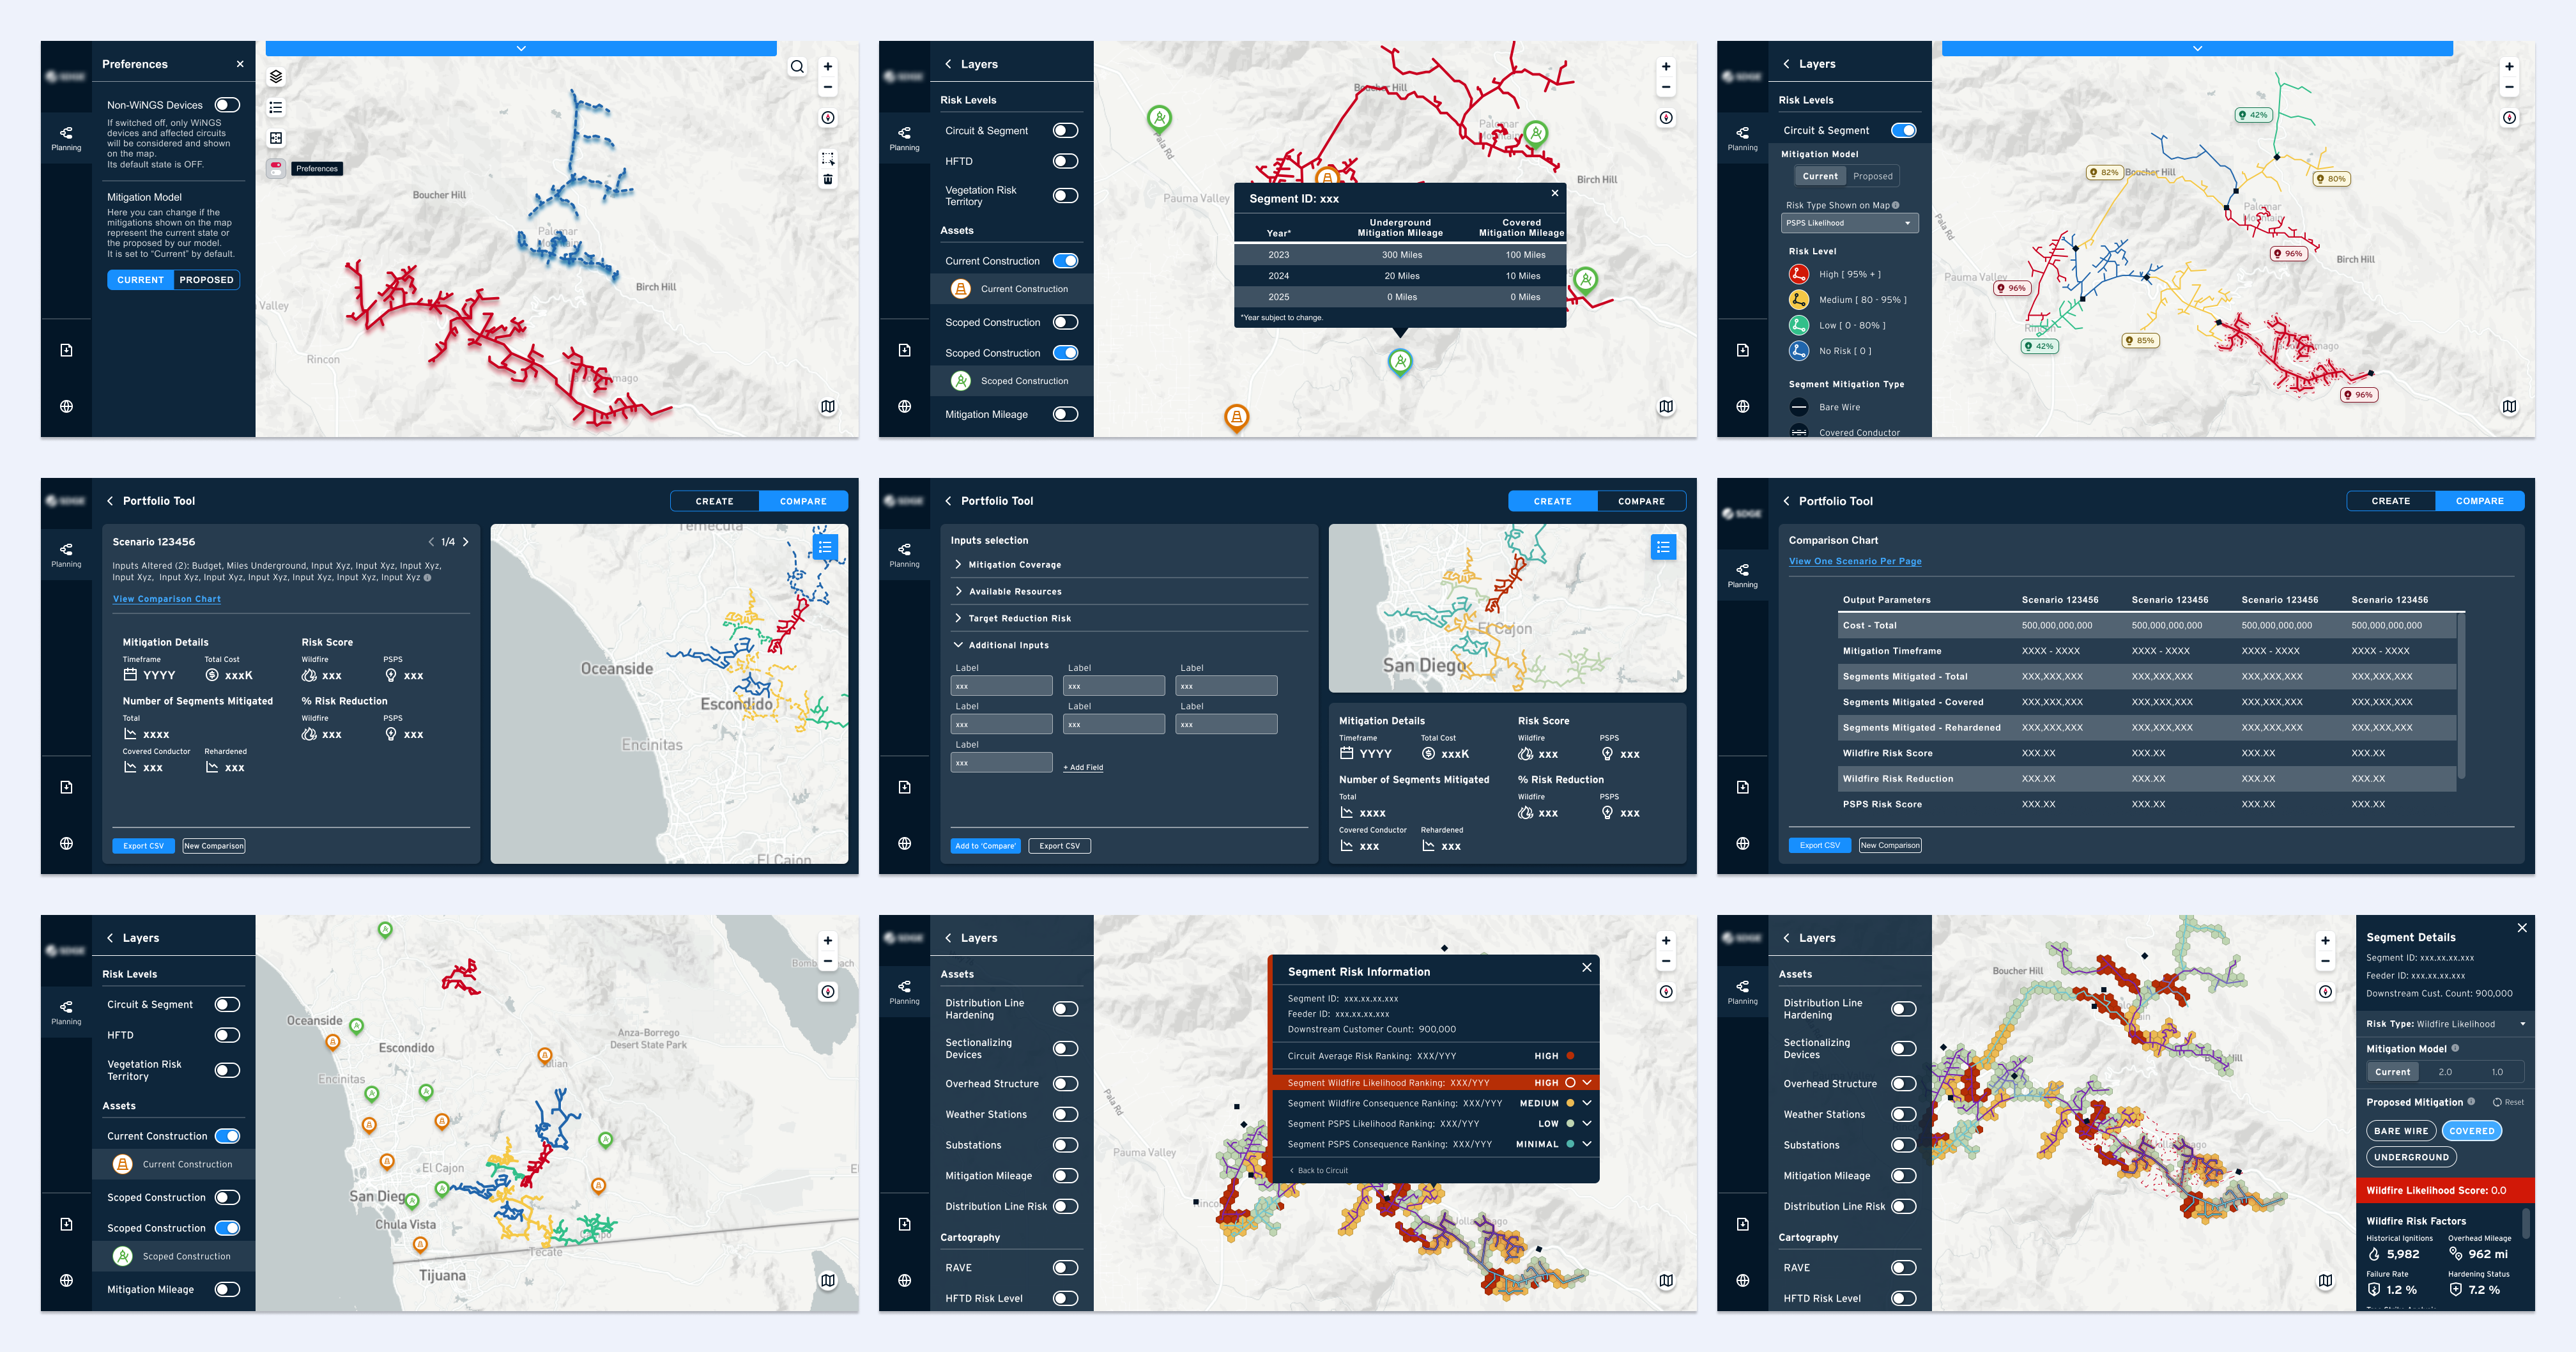
Final Design Sample: Sharing 9 of the 250+ screens designed for the platform.
Click on image to see expanded images.

Collaboration + Handoff

Throughout my work I am in a state of constant collaboration with my colleagues. From daily sync with the PM, to mind dazzling conversations with the data scientists.


I worked closely with engineers to validate design and implementation throughout the entire design process- not just during final handoffs . Outside of our daily team stand ups we also had a weekly design review to discuss new design or to double check builds before they went live.  This had huge impact on our work flows and reduced  overall questions, dependencies and kept design feasible.

View PrototypeView DM Prototype

Impact


The cloud based tool is used to analyze various grid-hardening mitigation models to reduce wildfire risk and minimize Public Safety Power Shutoffs (PSPS). In the first year the tool was implemented the company was able to plan and budget for 590 miles of power line mitigation projects. These changes keep the community safer from wildfire risk and decrease chance of community wide PSPS  by adopting grid automation, installing remote sensing tools and replacing aging or failure-prone equipment.

More planned mitigation projects mean less emergencies. Less emergencies mean the less chaos and more community notifications. The company saved over 11 million in PSPS notification penalty fees compared to their competitors.
Award Winning Design

Platform Recognition:
-2022 CIO 100 Award
-Fast company’s 2022 World Changing Ideas list
-2023 Bertha Lamme Top Innovator Award
-2023 Outstanding Reliability Performance in the West Award 2
-2023 Outstanding Grid Sustainability Award

Accenture Business Impact:
-West Market Unit V360 Client Co-Innovation Award
-Accenture’s West Experience Client Value Competition
-Client became a Diamond Client for Accenture


Want to know more? Contact me for more details or explore the prototype! 

Contact Me