Victoria Boulet
VB

Using machine learning to mitigate California wildfires

The Problem:

EOC Liaisons need to pivot between six tools simultaneously to attempt to gain insight about potential wildfire and PSPS threats. Leading to large gaps for human error and elongated analysis investigation time (~40 hours per emergency).

The Challenge:

The approach involved converting the company's existing Excel spreadsheets into a geospatial and visual tool to help strengthen the region's resilience in the face of worsening climate conditions and improve community health.

Impact:

The implementation of the platform resulted in 250x faster investigation analysis time. Cutting emergency response time from 40 hours per wildfire to 10 minutes.  

My Role:

Lead Product Designer

Tools:

Figma, Mural, Maze

Define: Understand & Explore

The Problem

EOC Liaisons and Commanders need to pivot between six tools simultaneously to attempt to gain insight about potential wildfires and PSPS threats. This leads to large gaps for human error and elongated analysis investigation times.

In Numbers

2020 power shutoffs left over 100,700 customers in the dark due to emergencies or poor planning
In the last 50 years CA wildfires increased in size by roughly 800%

Discover: Empathize & Define

Research Goals

I aimed to investigate how data scientists could benefit from a highly visual and geospatial tool that enhances their ability to identify potential wildfire and PSPS risks.

Research Methods

To achieve this goal, I connected with stakeholders and users weekly to understand their current processes and identify opportunities for improvement.

The research aimed to achieve the following objectives:

1. To gain insight into how current users identify potential wildfire and PSPS risks and their existing processes.

2. To determine the value of a geospatial web tool in enhancing decision-making abilities during emergencies such as wildfires and PSPS events.

3. To understand the process of identifying potential PSPS threats and explore how machine learning can be utilized to prevent them.

4. To explore the trade-off between providing a snapshot view of current data and the need for in-depth analysis.

User Interviews, Workshops & Exploration

In addition to meeting with stakeholders and internal users weekly, I conducted workshops with 10-20 utility employees who work with the data that determines emergency events daily. The workshops aimed to define various types of users and identify current setbacks and opportunities using the "How Might We" and "5W +1 H" techniques. Furthermore, the workshops helped to define the Golden Path for the project. I also conducted various sessions for prototype exploration and review to ensure that the design met the end users' needs.

Key Findings

Our research and discussions revealed the following key findings that needed to be addressed to achieve our goals of strengthening SoCal's resilience against wildfires and PSPS events:

1. The current tool lacked a visual interface and required users to utilize various tools to complete their work, which made the process time-consuming and less efficient.

2. The update intervals needed to be more consistent, which affected the data's accuracy and relevance.

3. The data models were not user-friendly and required a high level of expertise to digest, which limited the tool's accessibility to a broader range of users.

4. The current tool could not integrate with external apps, which limited its functionality and flexibility. The risk scenario management needed to be automated, as it left room for human error and increased the risk of missing potential risks.

Overall, these findings highlighted several areas for improvement that could be addressed by creating a more user-friendly and visual tool, adding external features such as maps/dashboards, automating risk scenario management, and ensuring consistent and up-to-date data.

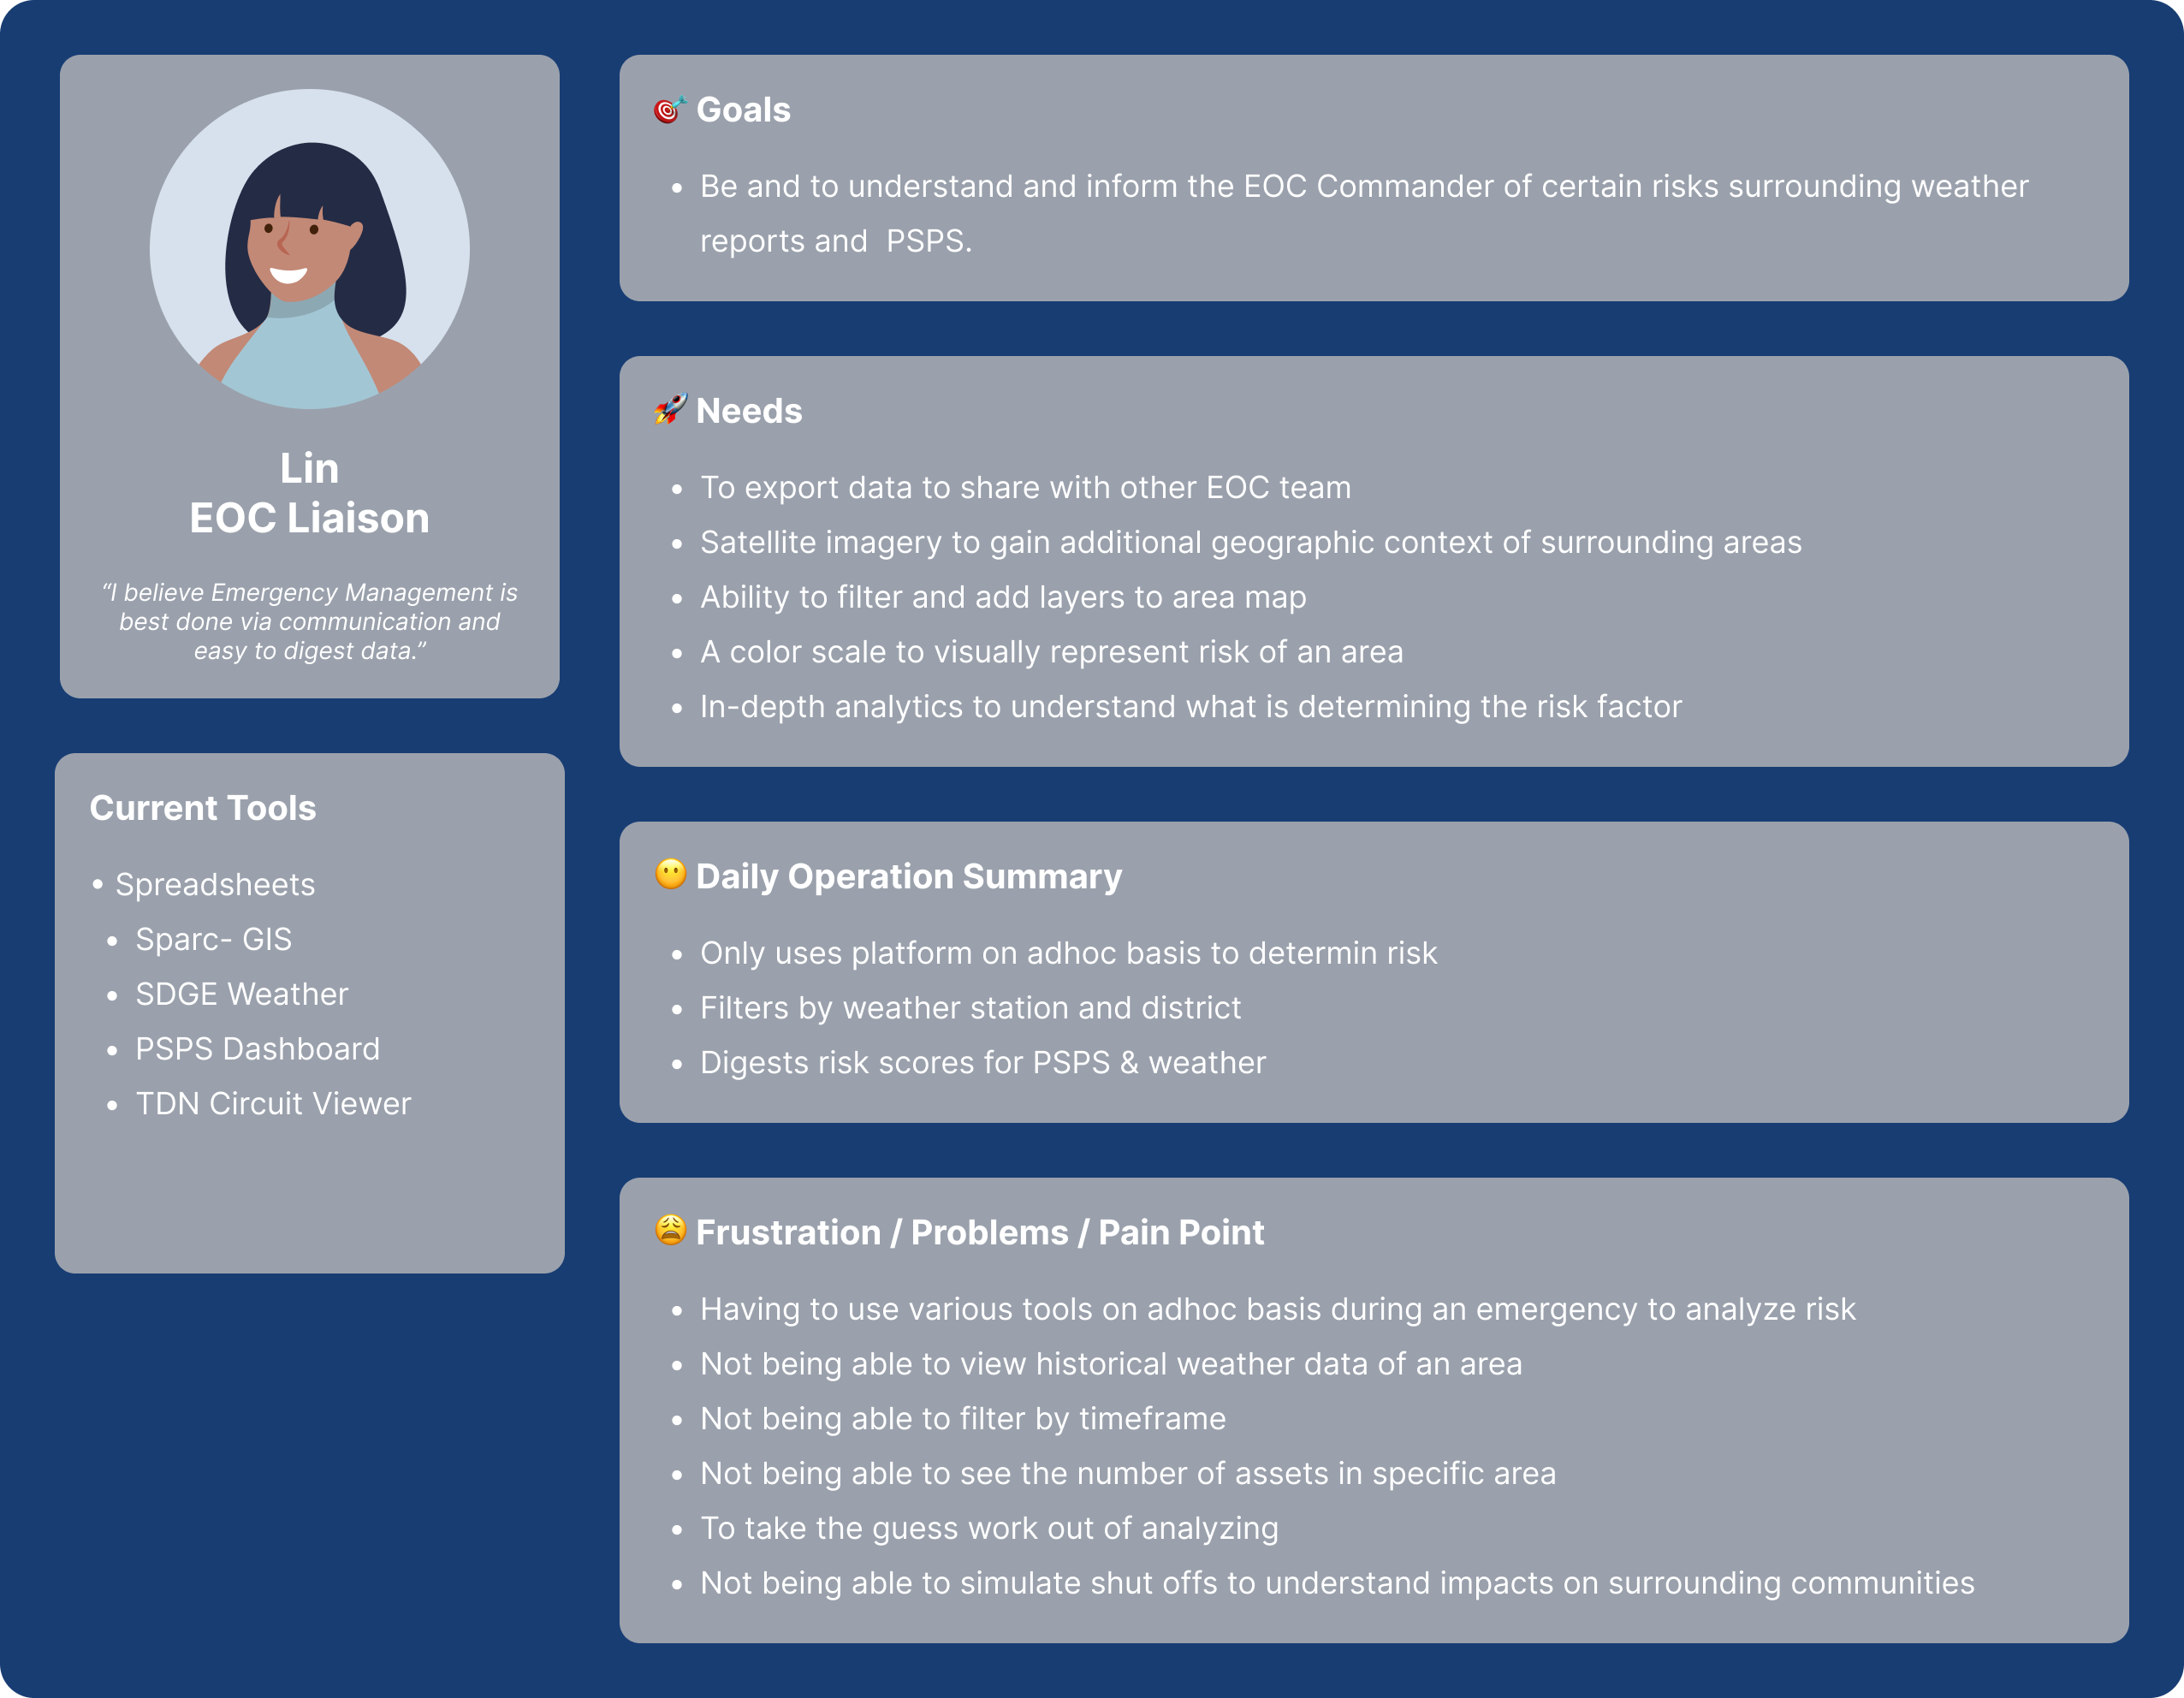
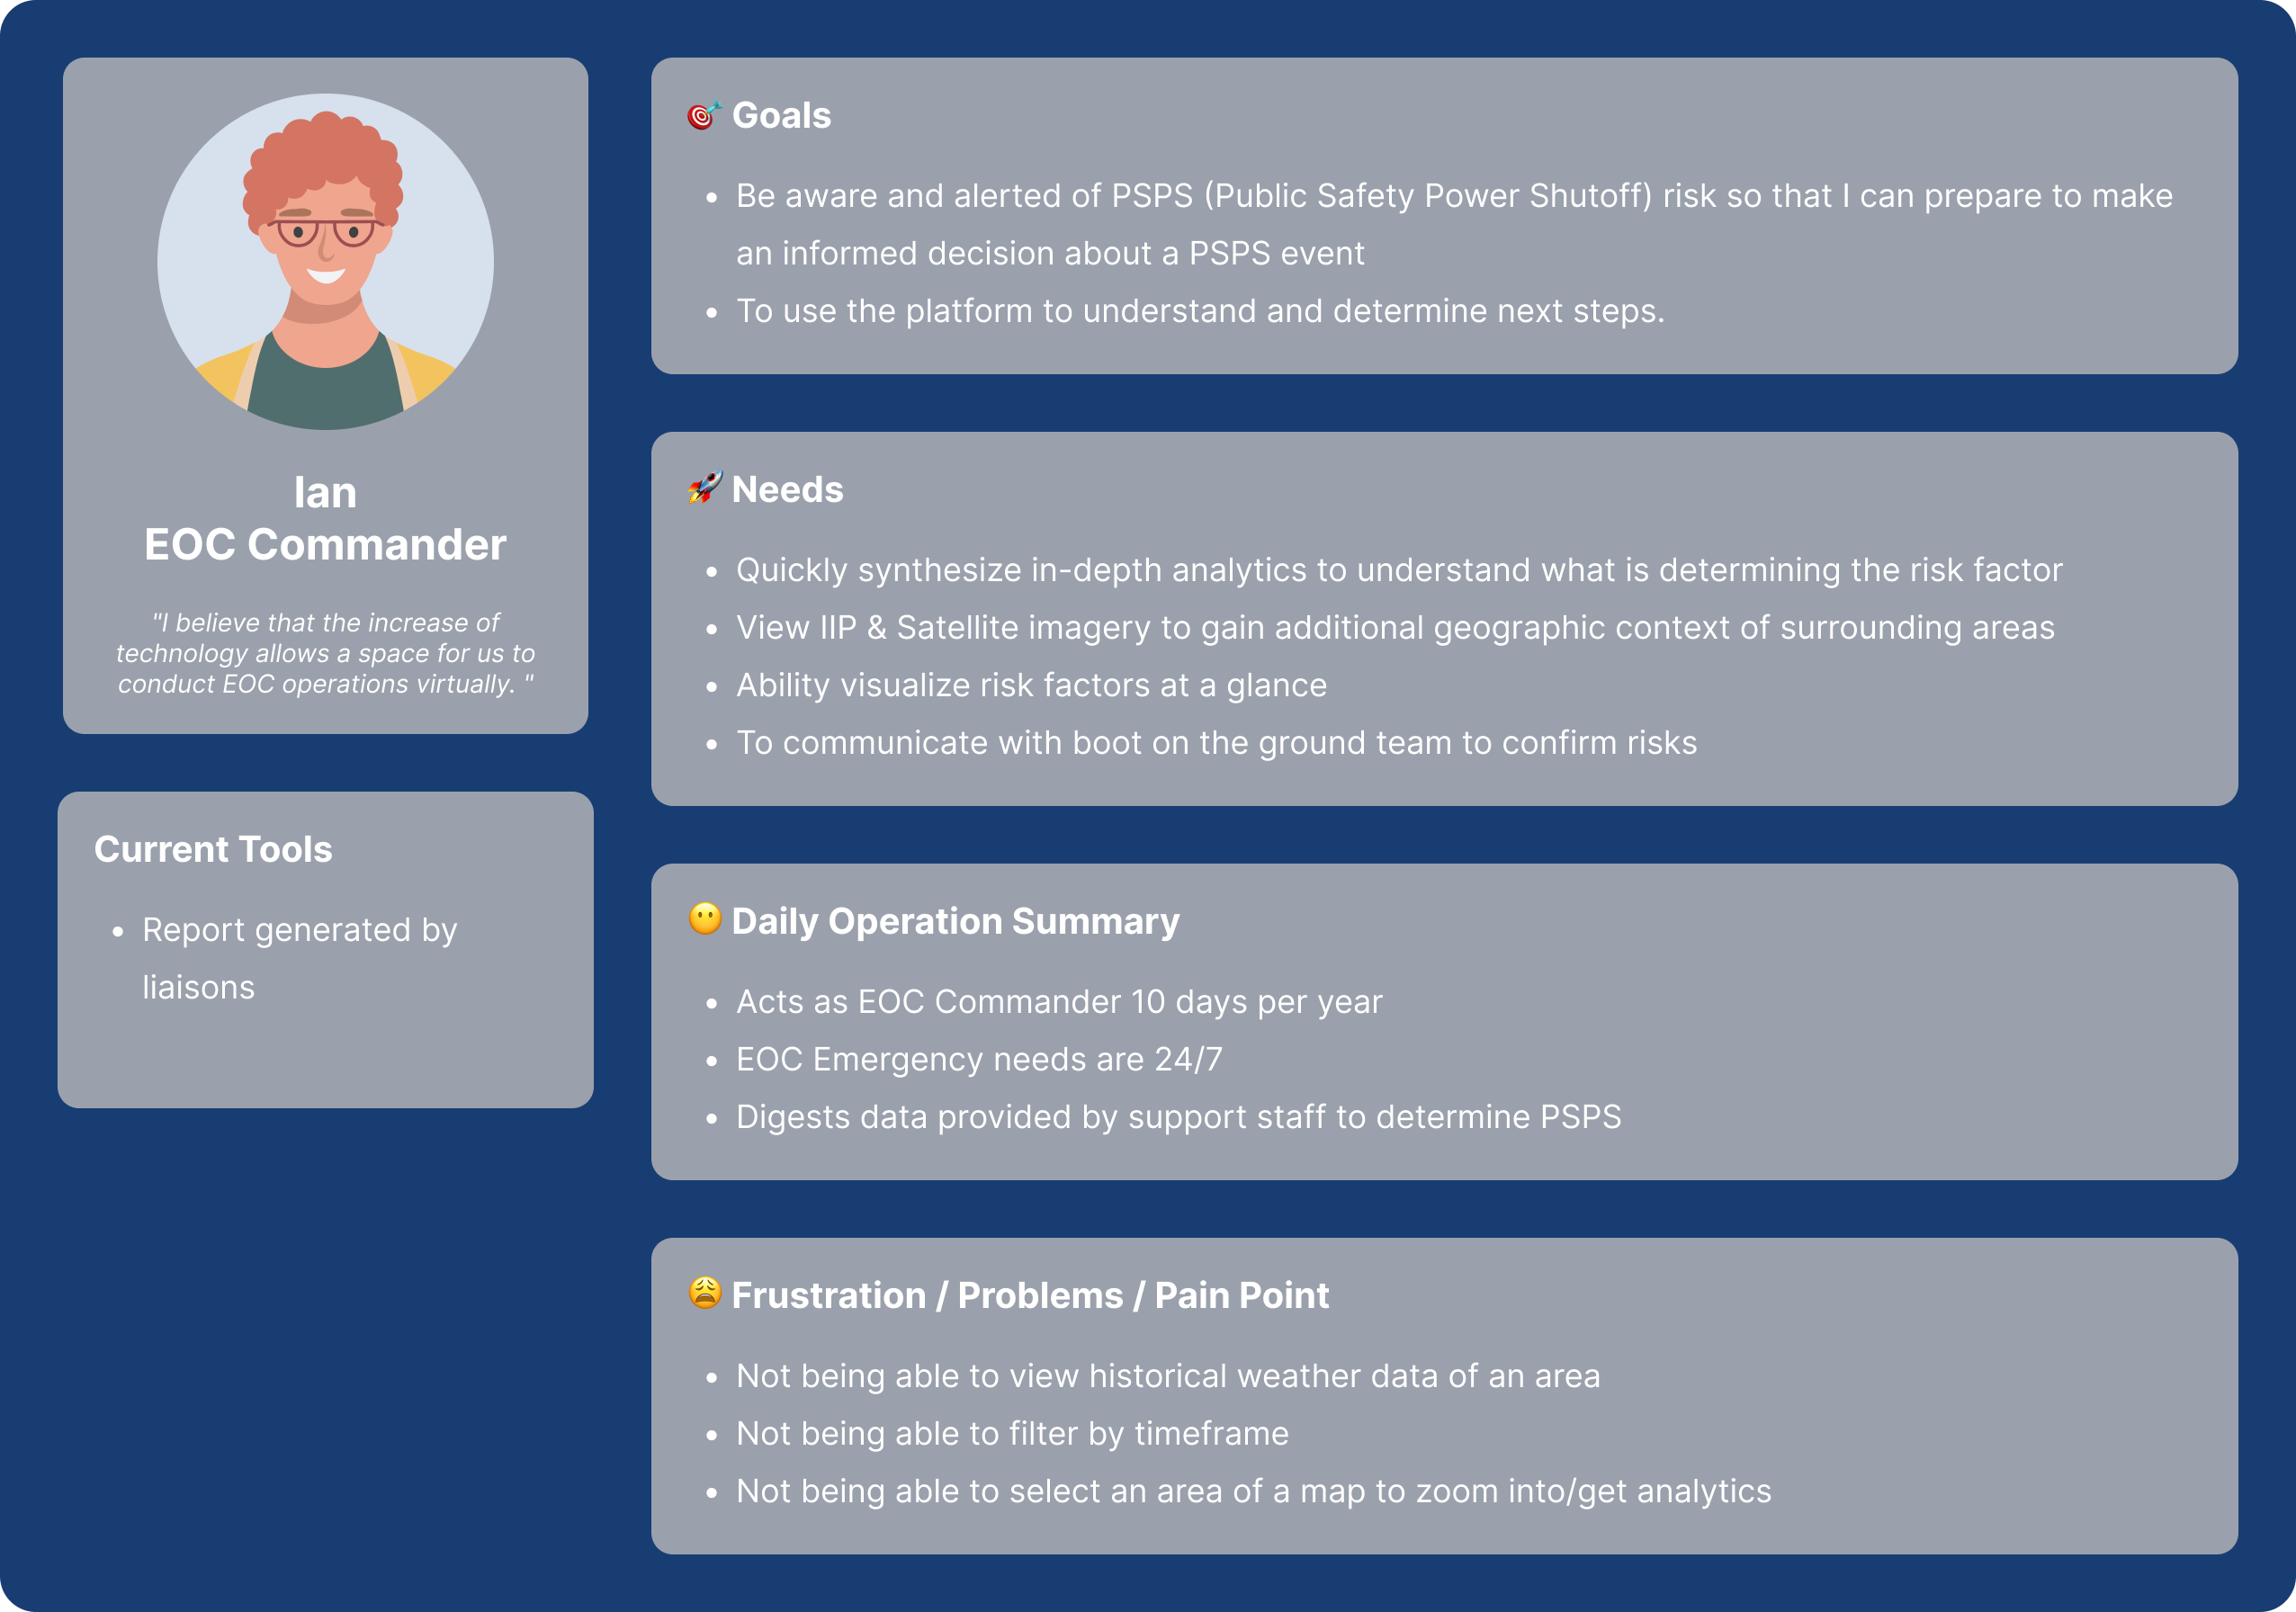
Meet Lin & Ian

Lin and Ian were created based on feedback from various user interviews and after facilitating a Persona Profile workshop.

Develop

Design System

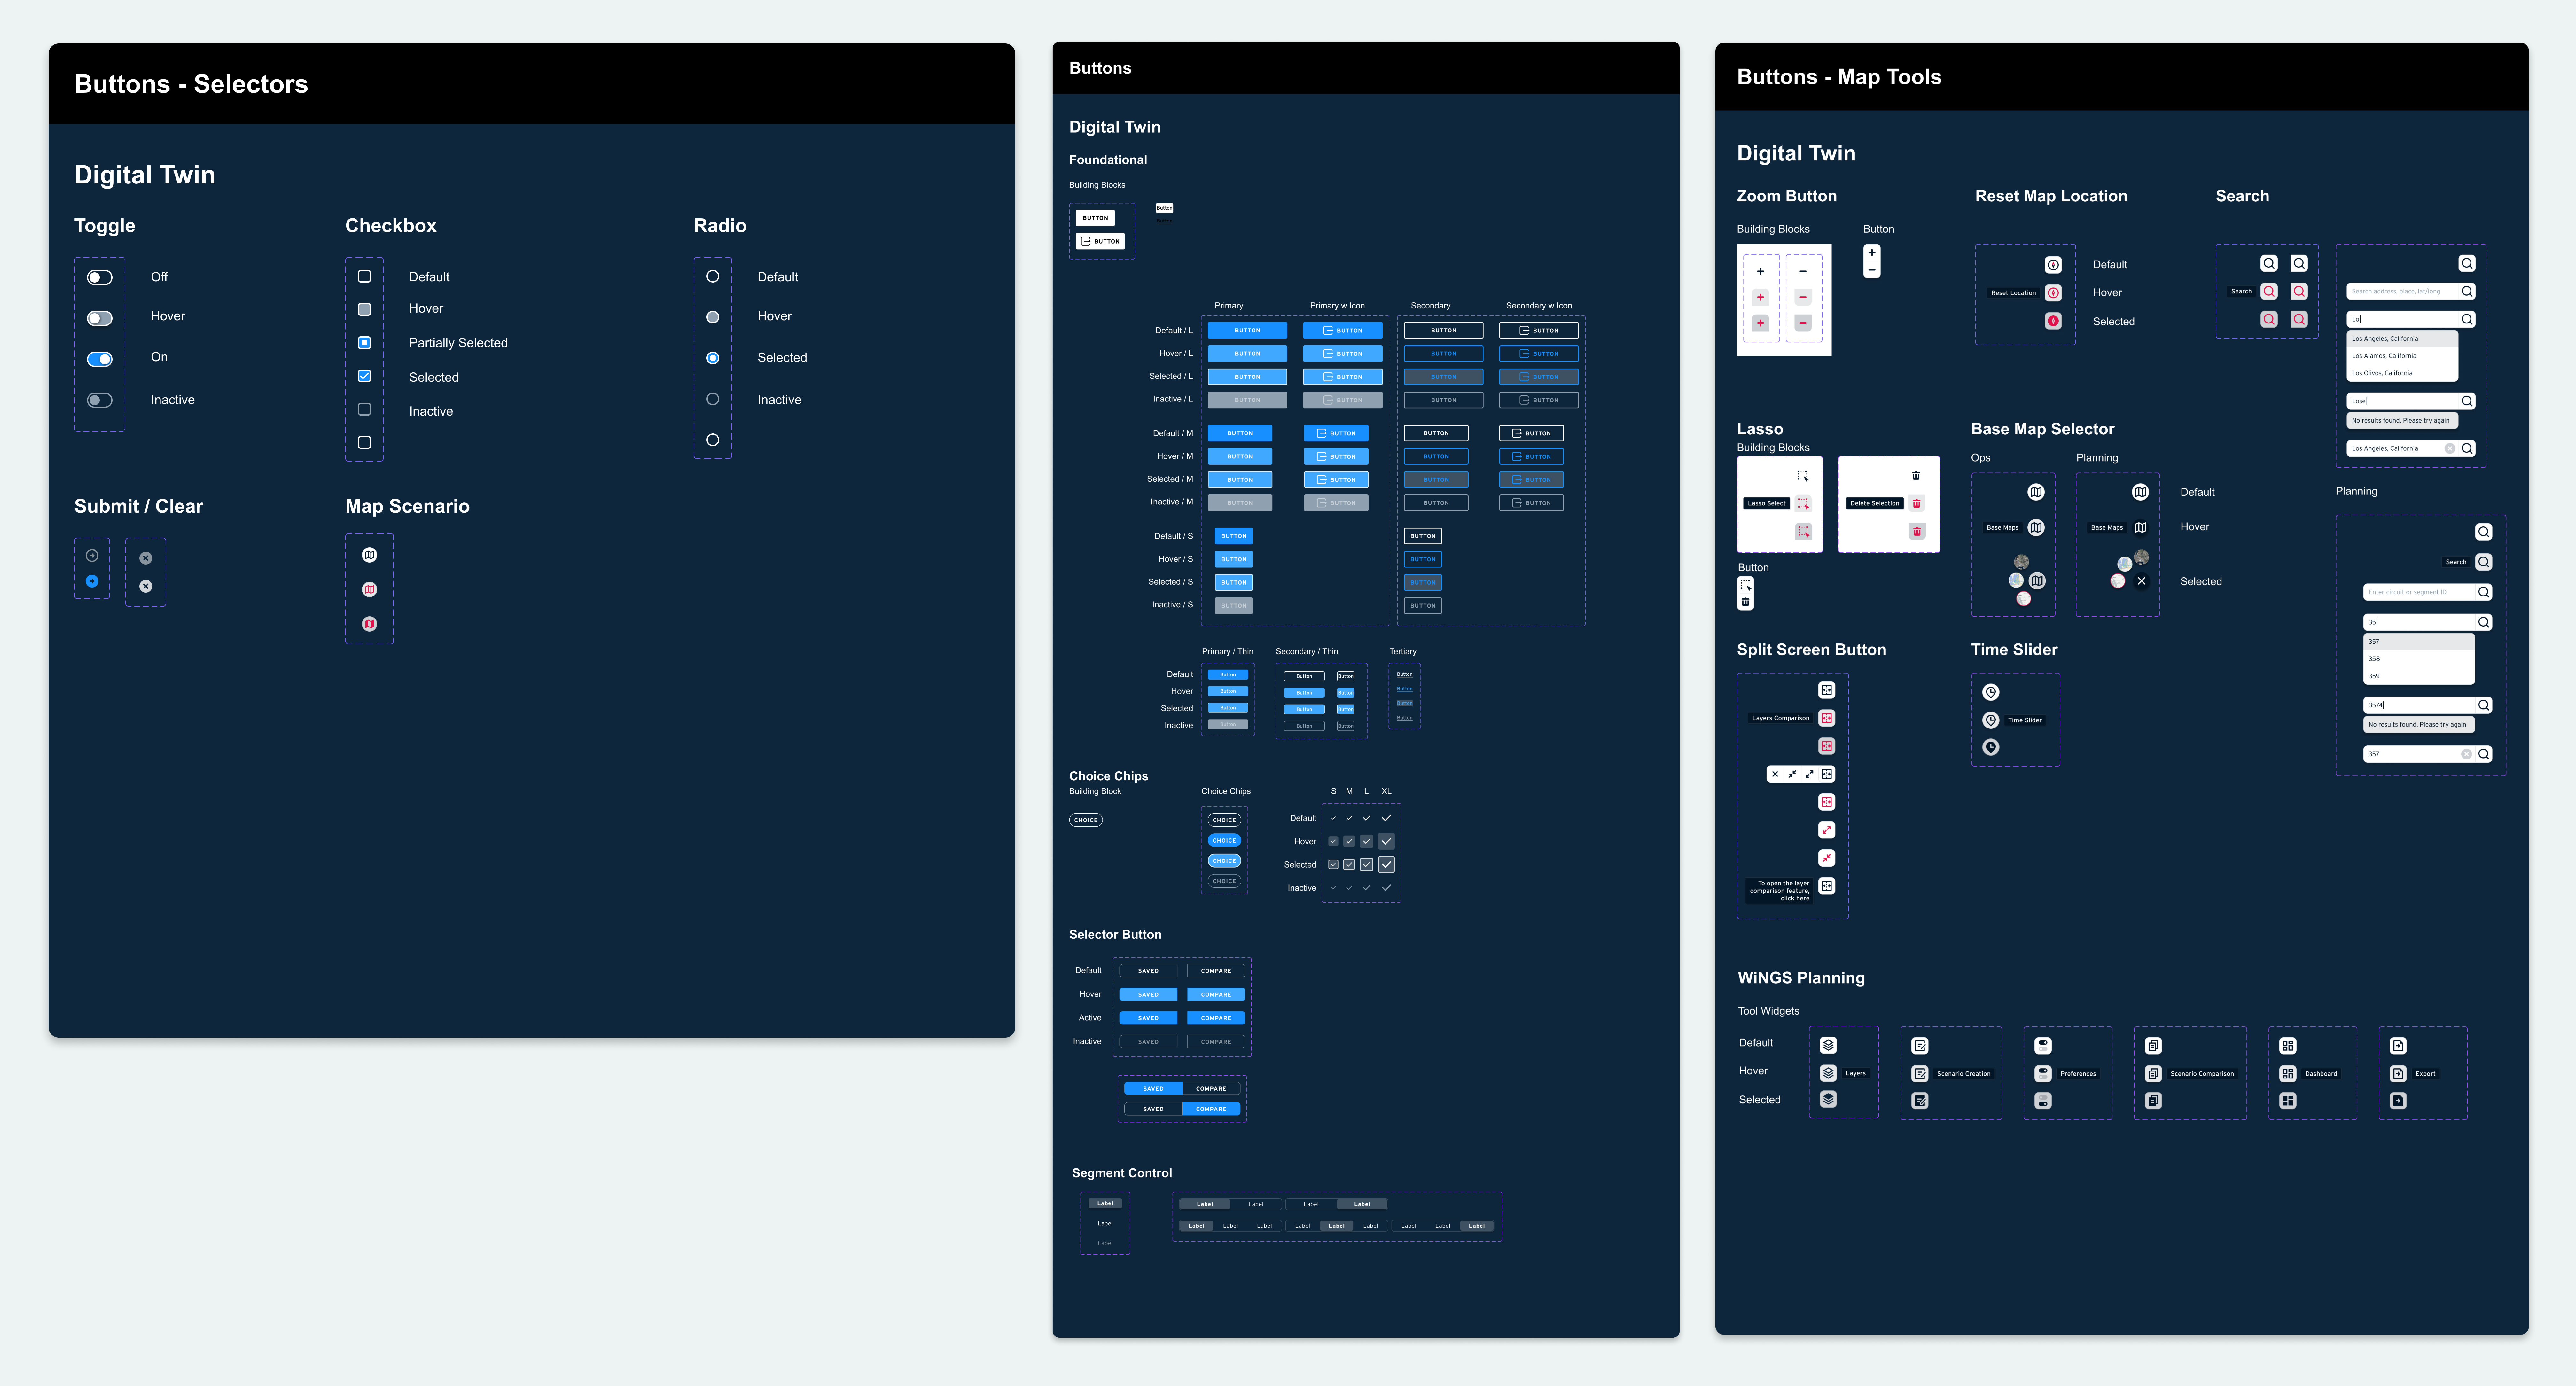
I worked along two other designers to create and maintain a comprehensive design system that incorporated our new components. The design system is now being used across the company's Digital Twin product and initiatives. We continuously updated the design system with new components and variations. This allowed us to adapt to changing requirements and feedback from users and stakeholders, without sacrificing consistency or quality. Overall, the design system was a key tool in the overall design process, enabling us to work more efficiently, collaborate more effectively, and deliver high-quality designs that met the client's needs and exceeded their expectations.

Design System Sample: Buttons
Click on image to see expanded images.

Deliver

Final Designs

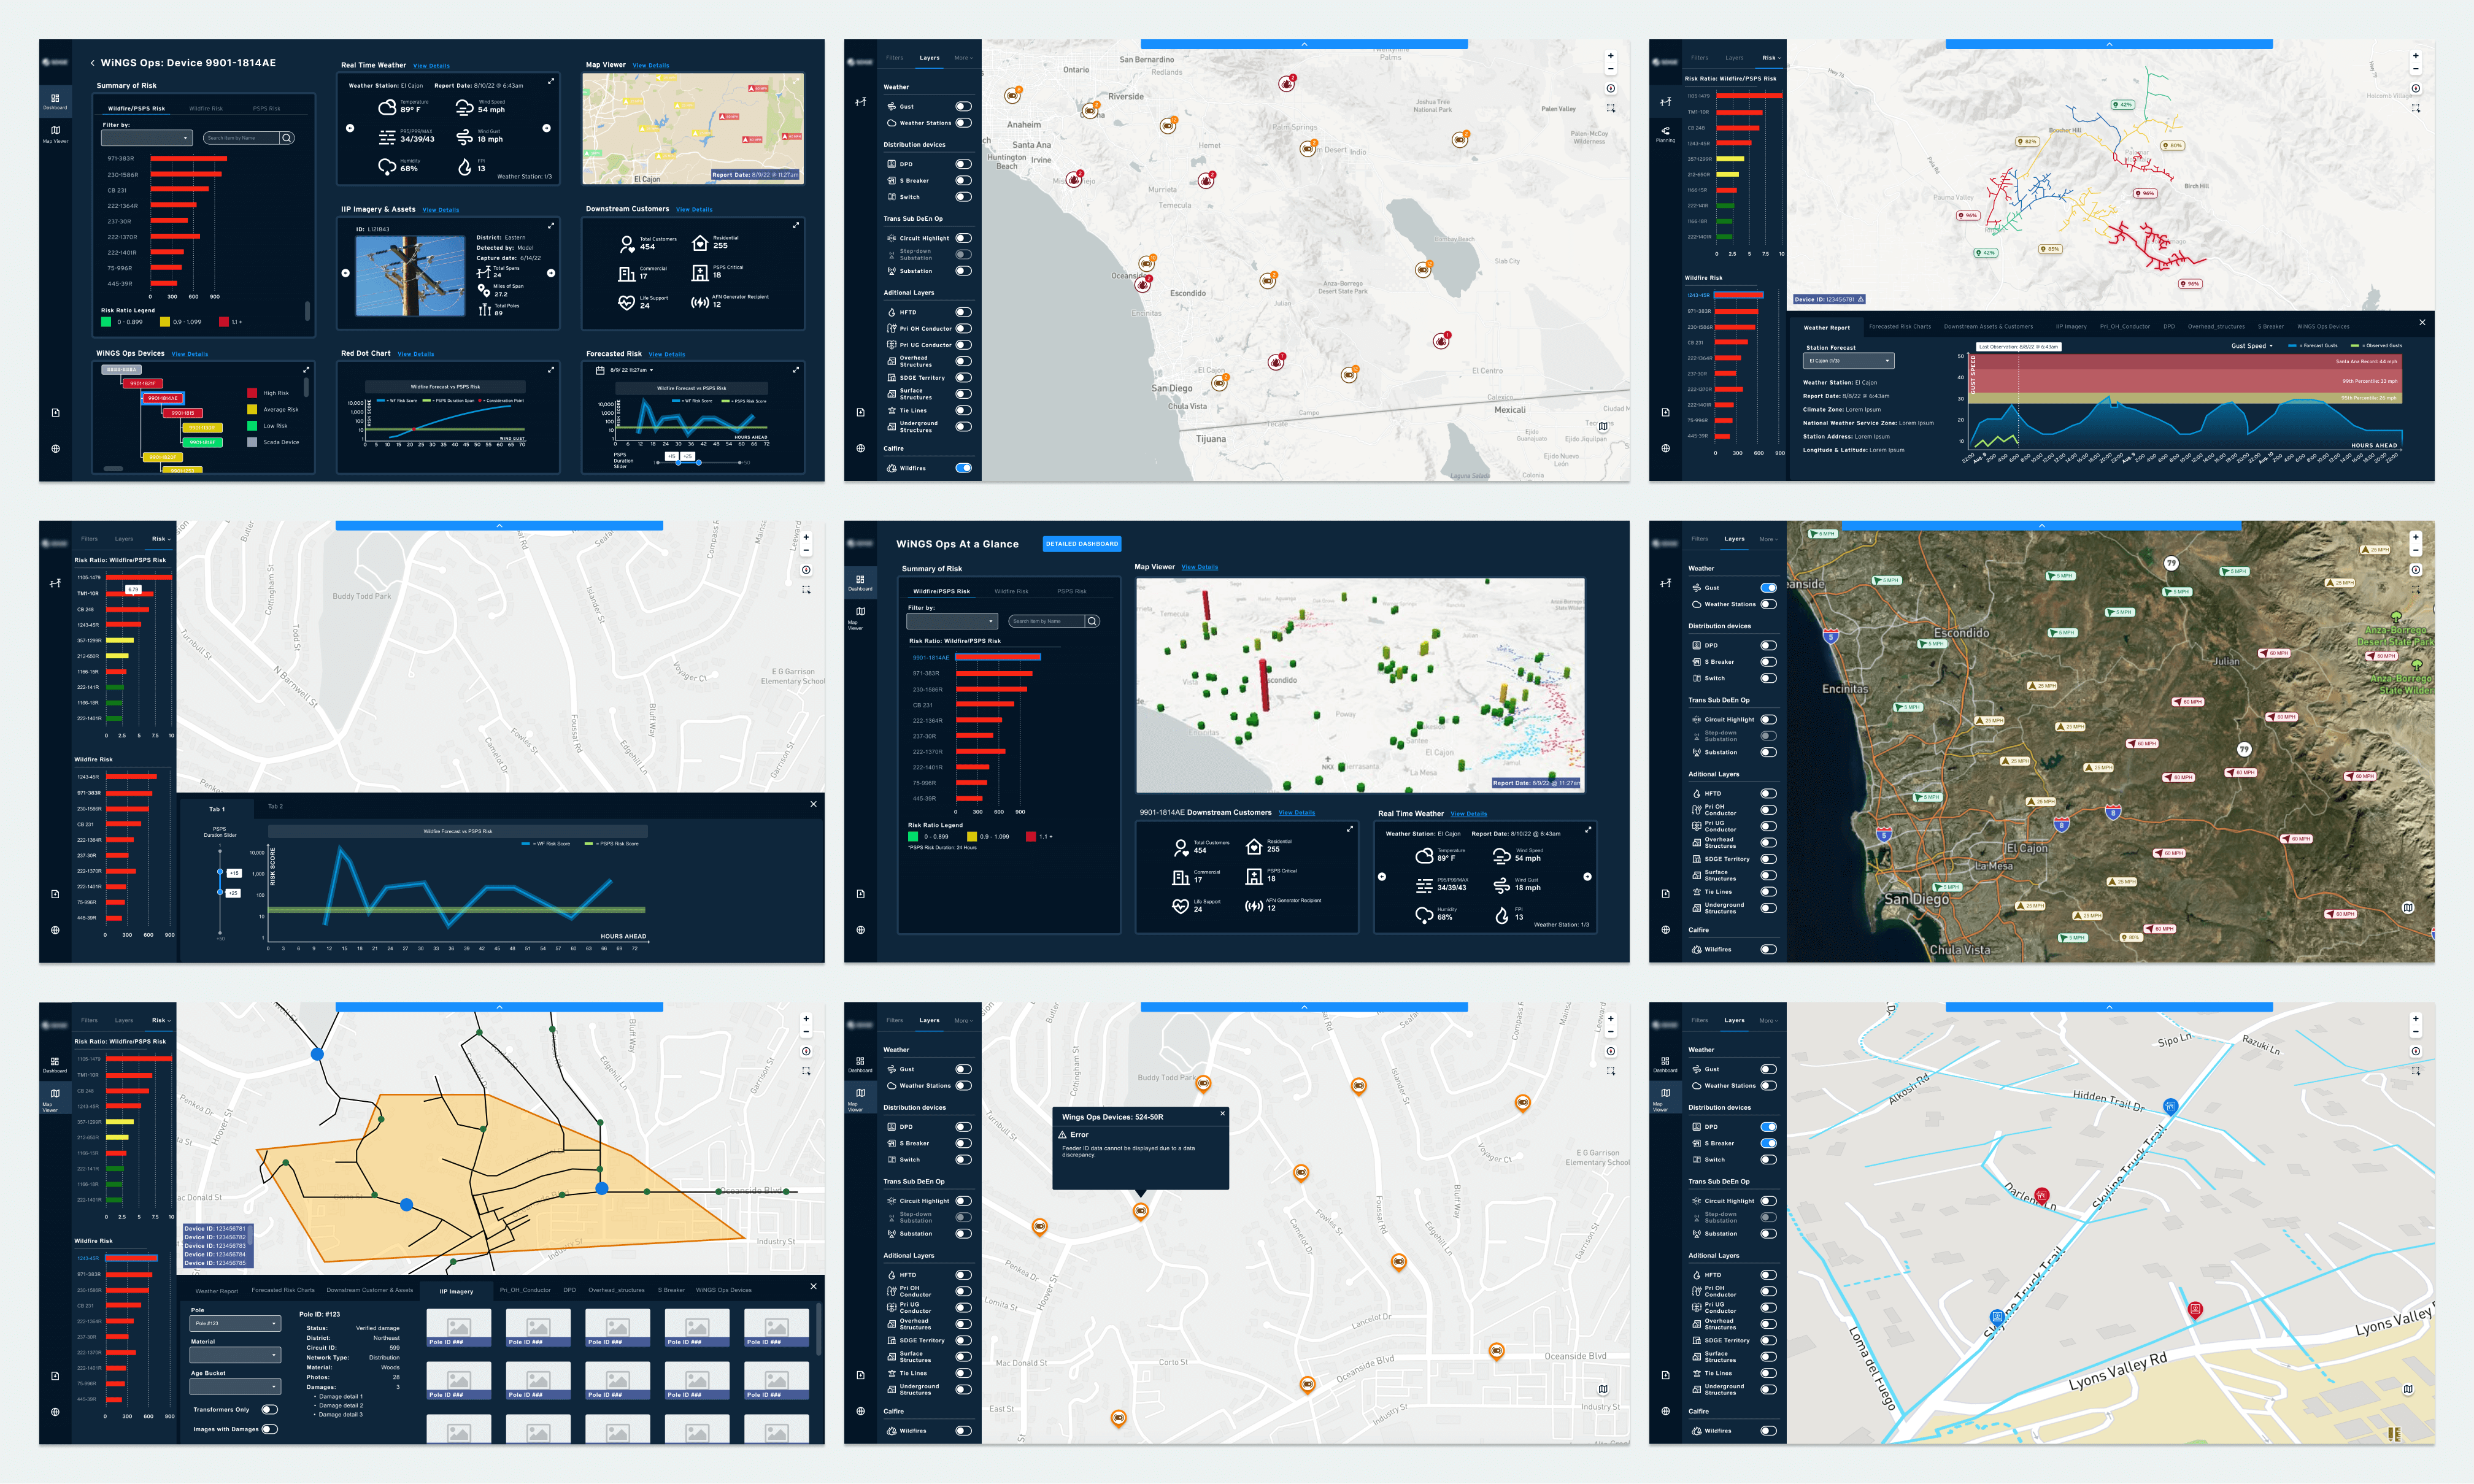
The finalized wireframes represent a significant improvement over the previous version. They enable users to quickly validate data through the dashboard, enhancing their ability to digest current fire and PSPS emergencies and to plan ahead for potential risks. With increased user-friendliness, the new design empowers users to focus on proactive planning rather than reactive analysis. By providing a high level of scenario control and documentation and optimized scenario classification, the tool enables business users and decision-makers to better understand the risk factors involved. This enhanced usability ultimately leads to more informed decision-making, allowing the company to mitigate wildfire and PSPS risks better and improve local communities' health and safety.

Final Design Sample: Sharing 9 of the 250+ screens designed for the platform.
‍Click on image to see expanded images.

Impact

The implementation of the new data-driven compliance platform has resulted in significant benefits. Including 250x faster investigation analysis time. Cutting emergency response time from 40 hours per wildfire to 10 minutes. Our team included 107 new data attributes that helped decrease human error and false positive alerts. This lead to fewer power shut offs and less customers left in the dark.  Additionally, the platform's scalability and powerful interactive compliance dashboard provide a 360-degree view for reporting, enhancing decision-making capabilities for the Data Analysts and EOC Commanders.

The WiNGS Ops project was such a success that the client  extended our team to work on scalability of the platform (WiNGS Planning).

Award Winning Design

Recognition :
-2022 CIO 100 Award
-Fast company’s 2022 World Changing Ideas list
- Presented at the 2024 DISTRIBUTECH International Conference

Accenture Business Impact:
-West Market Unit V360 Client Co-Innovation Award
-Accenture’s West Experience Client Value Competition
-Client became a Diamond Client for Accenture

Want to know more? Contact me for more details! 

Contact Me